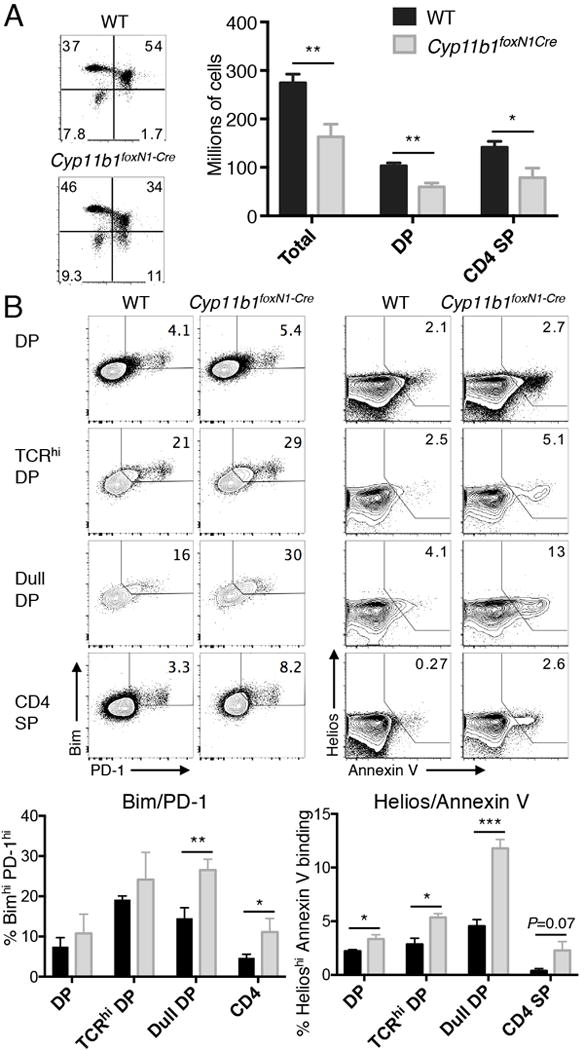
FIGURE 3. Increased negative selection of thymocytes developing in the absence of corticosterone production by TECs.

(A, left panels) CD4 versus CD8 profiles of representative 5 week-old AND TCR WT and Cyp11b1foxN1-Cre thymi. The numbers represent the percentages in each quadrant. (A, right panel) Total thymocytes and subsets from five week-old WT (n=10) and Cyp11b1foxN1-Cre (n=6) Rag2-/- mice. (B) Increased indicators of negative selection in Cyp11b1foxN1-Cre AND TCR thymocytes. PD-1 and Bim expression (upper left panels) and Helios expression and Annexin V-binding (upper right panels) are shown in the indicated subsets of WT and Cyp11b1foxN1-Cre AND TCR thymocytes. Shown below each are the means and SEM of three (Bim/PD-1) and four (Helios/Annexin V) mice. *P < 0.05, **P < 0.005, ***P < 0.0005.
