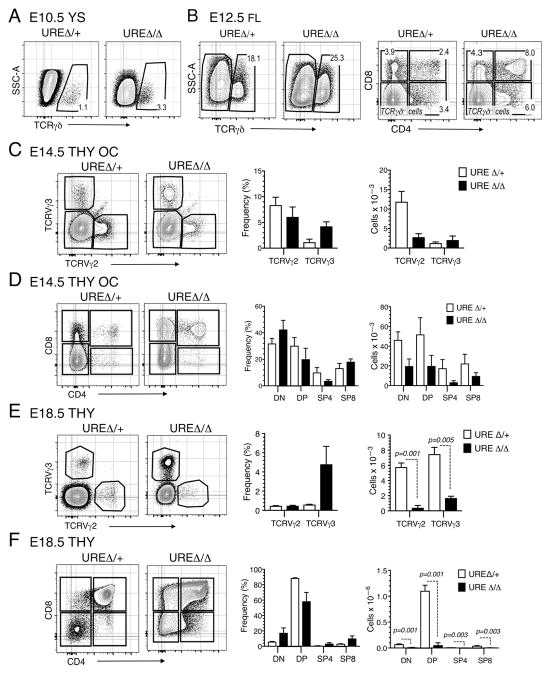
Fig. 1. The initial waves of fetal T cell development emerge in UREΔ/Δ embryos.
(A) FACS plots showing production of TCRγδ+ cells from E10.5 YS from UREΔ/Δ and UREΔ/+ embryos following 13 days of culture over OP9-DL1 stroma. (B) FACS plots showing the frequency of TCRVγ2+, Vγ3+, CD4+ CD8+, CD4+, and CD8+ cells generated from E12.5 UREΔ/Δ and UREΔ/+ FL following seeding on OP9-DL1 stroma. Frequencies of gated populations are indicated. Each panel is representative of 2 independent experiments. (C) FACS plots and graphs showing the frequencies and numbers of TCRVγ2+, Vγ3+ cells harvested from E14.5 UREΔ/Δ and UREΔ/+ thymic lobes placed in organ cultures for 3 weeks. (D) FACS plots and graphs showing the frequencies and numbers of DN, DP, SP4 and SP8 cells generated in E14.5 UREΔ/Δ and UREΔ/+ thymic lobes placed in organ cultures for 3 weeks. Data are representative of 4 independent experiments. E14.5 UREΔ/Δ: n = 5–6 lobes; E14.5 UREΔ/+: n = 5–8 lobes. (E) FACS plots and graphs showing the frequencies and numbers of DN, DP, SP4 and SP8 cells generated in E18.5 UREΔ/Δ or UREΔ/+ thymic lobes. Mean ± SEM and t test p values are shown. E18.5 UREΔ/Δ: n = 8–10 lobes; E18.5 UREΔ/+: n = 4 lobes.

