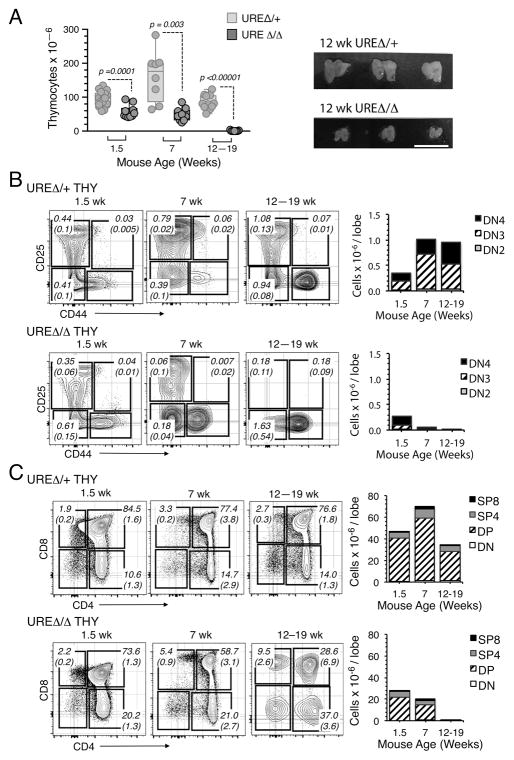
Fig. 2. Thymopoesis wanes by 12 weeks of age in UREΔ/Δ mice.
(A) Left panel: Evolution of total thymic cellularity in UREΔ/Δ and UREΔ/+ mice with age. Each symbol represents a mouse. Means ± SEM and p values are shown. Right panel: Photomicrograph of thymuses from 12 wk old UREΔ/Δ and UREΔ/+ mice (Bar = 1.0 cm). (B) Left panels: FACS plots showing the frequencies of Lin− DN2, DN3 and DN4 cells in the thymus of 1.5, 7 and 12–19 wk old UREΔ/Δ and UREΔ/+ mice. Right panels: Number of Lin− DN2, DN3 and DN4 thymocytes in UREΔ/Δ and UREΔ/+ thymii with age. Numbers in plots indicate the frequency and (SEM) for each population in total thymus. t test comparisons for DN2, DN3, and DN4 subpopulations in UREΔ/Δ and UREΔ/+ thymuses yielded values of at least p<0.0001. (C) Left panels: FACS plots showing the frequencies DN, DP, SP4 and SP8 cells in the thymus of 1.5, 7 and 12–19 wk old UREΔ/Δ and UREΔ/+ mice. Right panels: Number of DN, DP, SP4 and SP8 thymocytes in UREΔ/Δ and UREΔ/+ thymii with age. Numbers in plots indicate the frequency and (SEM) for each population in total thymus. t test comparisons for DN, DP, SP4 and SP8 thymocytes in UREΔ/Δ and UREΔ/+ thymuses yielded values of at least p<0.0005. The data in Figures 2B and 2C are based on analysis of the following numbers of mice: 1.5 wk: UREΔ/+ (n=14) and UREΔ/Δ (n=10); 7 wk: UREΔ/+ (n=5) and UREΔ/Δ (n=6); 12–19 wk: UREΔ/+ (n=9) and UREΔ/Δ (n=9).

