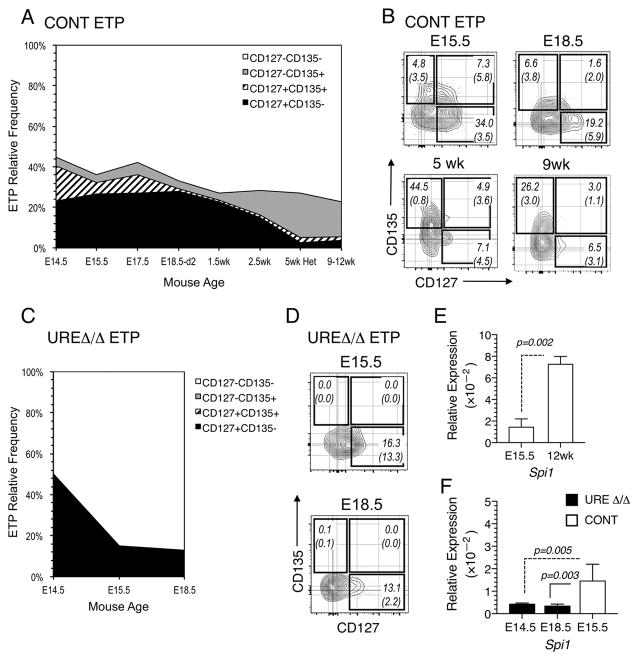
Fig. 5. ETPs emerge in successive waves distinguished by CD127 and CD135 expression.
(A) Graph showing the relative frequencies of CD135+ CD127−, CD135+ CD127+, CD135− CD127+ and CD135− CD127− ETPs in the thymus of B6 control (CONT) mice at the indicated fetal, neonatal and adult ages. Mean frequencies and (SEM) are indicated. (B) FACS plots showing CD135 and CD127 expressing ETP populations in the thymus of B6 control (CONT) mice at the indicated fetal and adult ages. (C) FACS plots showing CD135 and CD127 expressing ETP populations in the thymus of UREΔ/Δ mice at the indicated fetal ages. Mean frequencies and (SEM) are indicated. (D) FACS plots showing the frequency of CD135+ CD127−, CD135+ CD127+, CD135− CD127+ and CD135− CD127− ETPs in the thymus of UREΔ/Δ mice at the indicated fetal ages. Data are representative of 3 to 4 independent experiments in which thymic lobes from 5 to 10 fetal/neonatal mice were pooled. Day 15, 2.5, and 5 wk values were obtained with 7 to 10 mice per age group. (E) Expression of Spi1 relative to Gapdh in ETPs from E15.5 and 12 wk old B6 mice. The data are based on analysis of ETPs purified from four independently obtained fetal and two adult thymus pools. Each fetal pool was prepared from 6–10 fetuses and each adult pool was prepared from 4–6 mice. (F) Expression of Spi1 relative to Gapdh in ETPs from E14.5 and E18.5 UREΔ/Δ and E15.5 B6 mice. The data are based on analysis of ETPs purified from two independently obtained E14.5 UREΔ/Δ, two E18.5 UREΔ/Δ, and four B6 fetal thymus pools. Each fetal pool was prepared from 4–10 fetuses. qPCR reactions were performed two to three times on each sample in E and F. Mean ± SEM and p values are shown.

