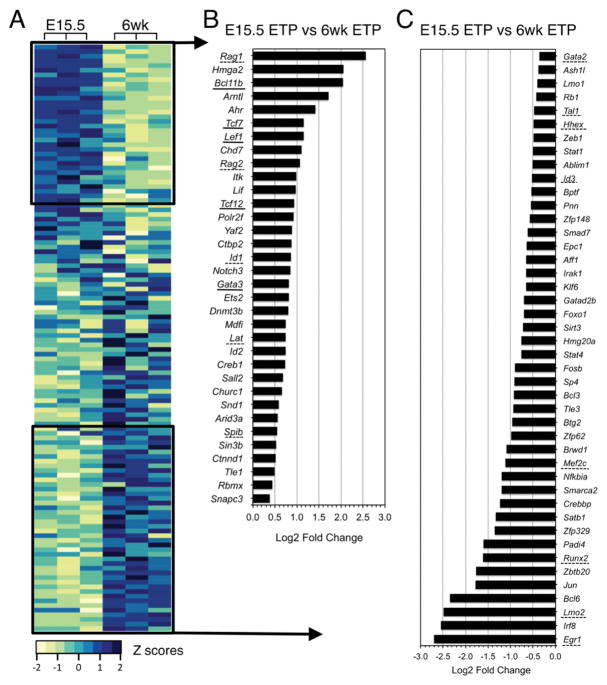
Fig. 6. Expression of key T lineage transcription factors differs between fetal and adult ETPs.
(A) Heatmap showing expression of selected transcription factors in ETPs from E15.5 and 6 wk old B6 mice. Log2 intensities were obtained from microarray data deposited by Belyaev et al (GSE24142) (23). The complete gene list is included in Supplemental Table 2. All genes were included in the 4,970 probes that passed the p<0.05 filter following ANOVA test as described by Belyaev et al. (23). Z-scores are shown for 3 independent samples for each mouse age. Dark blue: high expression levels; pale green: low expression levels. (B) Log2 fold change of transcription factors with higher expression in fetal than adult ETPs (E15.5 versus 6 wk). (C) Log2 fold change of the transcription factors with lower expression in fetal than adult ETPs (E15.5 versus 6 wk). Genes whose expression is regulated by PU.1 are underlined.

