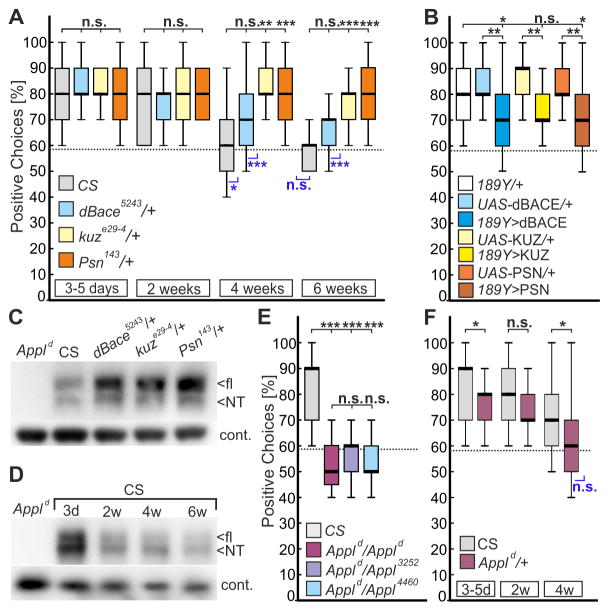
Figure 1. Reduced APPL processing promotes visual working memory in aged flies.
(A) Wild-type CS and heterozygous mutants for the three secretases were aged for up to six weeks and tested for positive choices in the detour paradigm (n = 25 males for all groups). Whereas CS shows a reduced performance with age, heterozygosity for kuz or Psn prevents this decline.
(B) Overexpression of secretases (UAS-kuz, UAS-dBace, or UAS-Psn) in R3-neurons with 189Y-GAL4 impairs the memory in 3-to-5-days-old flies compared to GAL4 and UAS-controls (n = 25 males).
(C) Western blot with head extracts from heterozygous secretase mutants (all 3-day old) show an increase in flAPPL using an antiserum against the N-terminus (NT) of APPL (Ab952M; [12]). Appld null-mutants were included as controls. A mouse monoclonal antibody against Glycerinaldehyd-3-Phosphat-Dehydrogenase (GAPDH) served as loading control.
(D) Western blot with anti-APPL and aged wild-type CS flies. Whereas the overall levels of APPL are increased in young (3d) CS flies compared to all other ages, the NTF/flAPPL ratio increases continuously with age (mean ratio 3d: 1.92 ± 0.125; 2w: 3.71 ± 0.35; 4w: 4.04 ± 0.63; 6w: 5.37 ± 1.08). The NTF/flAPPL ratio in 3d-old flies is significantly different from the ratio in aged flies: 3d/2w p = 0.0085; 3d/4w p = 0.0304; 3d/6w p = 0.0334 (n = 3). An unpaired t-test was used.
(E) Homozygous Appld null-mutants and transheterozygous mutants for hypomorphic Appl alleles show a complete loss of visual working memory (n = 16–25 females; age 3–5d).
(F) Heterozygous flies for the Appld null-mutant show a reduced orientation memory already when 3–5 days old that further declines with age (n = 25 females).
Boxes always signify 25% and 75%-quartiles, thick lines medians and whiskers 10% and 90%-quantiles. The random choice level of 58% is shown by a dashed line. Significance to this chance level is indicated in blue below the boxes (non-parametric data, sign test; parametric data, one-sample t-test. n.s., not significant; *, p<0.05; **, p<0.001; ***, p<0.001). Shapiro-Wilk test for normal distribution; Kruskal-Wallis ANOVA, and Bonferroni post-hoc were used. See Data S1 for statistical analysis and Figure S1 for a schematic outline of the detour paradigm.

