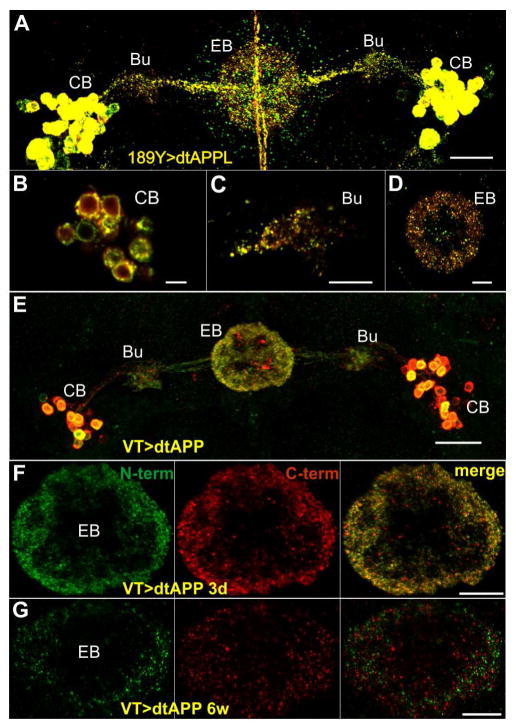
Figure 3. Cellular distribution of double-tagged APP/L and their fragments in R3 neurons.
(A–D) Localization of dtAPPL and its proteolytic fragments in R3 neurons. (A) Overview of dtAPPL expression in R3 neurons (56.25 μm z-projection; scale bar 20 μm); cell bodies (CB) in the cortex, dendritic fields in the bulb (Bu), and axonal projections in the ellipsoid body (EB) are indicated.
(B) Individual R3 cell bodies show different APPL processing (300 nm z-projection; scale bar 5 μm).
(C) Most dtAPPL in the dendrites in the blub is cleaved (300 nm z-projection; scale bar 10 μm.
(D) CTF/dAICD (red), N-terminal fragments (green), as well as full-length dtAPPL (yellow) can be detected in the axons in the EB (300 nm z-projection; scale bar 10 μm).
(E–G) Localization of full-length dtAPP (yellow), N-terminal (green), and C-terminal (red) fragments produced from two copies of the dtAPP transgene driven with VT45759-GAL4. (E) Overview of dtAPP expression in the R3-neurons (3-day old 48.75 μm z-projection; scale bar 20 μm). (F) In 3-day-old flies most of the fluorescent puncta in the axonal projections in the EB are yellow, indicating full-length APP or close proximity of cleaved fragments. (G) In contrast, reduced expression levels and minimal co-localization of the N- and C-termini can be observed in 6-week-old flies (3 μm z-projection; scale bar 10 μm). See Figure S3 for evaluation of the VT driver line and co-localization analysis (including 189Y driven dtAPP).

