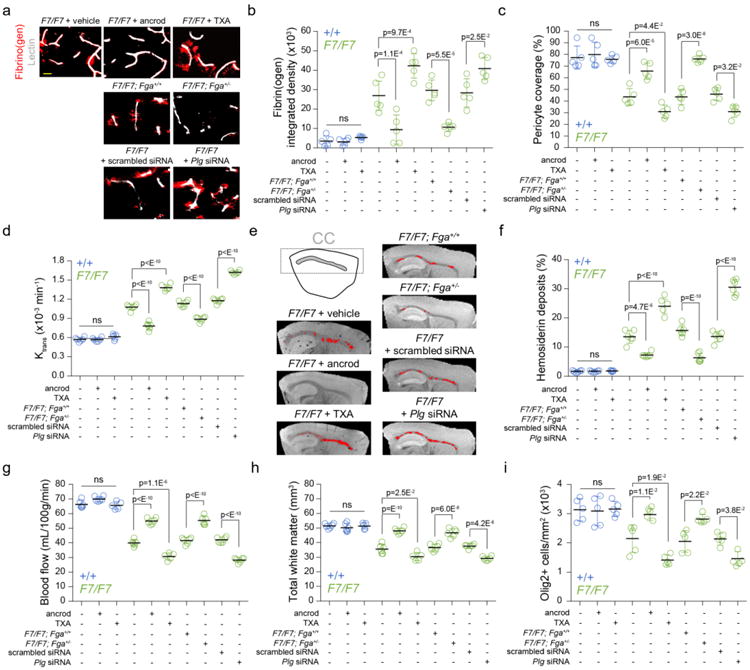
Figure 6. White matter changes in pericyte-deficient mice after pharmacological or genetic manipulations of systemic fibrinogen levels.

(a) Extravascular fibrin(ogen) deposits in the corpus callosum (CC) of 12-week old F7/F7 mice treated with vehicle, ancrod and tranexamic acid (TXA) (upper panels); or F7/F7 mice crossed with fibrinogen-(Fga) deficient +/- mice compared to littermate Fga+/+ controls (middle panels); or F7/F7 mice treated with control scrambled siRNA or plasminogen (Plg) siRNA for 7 days (lower panels), as described in Methods (bar = 10 μm). (b-c) Quantification of fibrin(ogen)-positive extravascular deposits (b) and CD13-positive pericyte coverage (c) in the CC of 12-week old F7/F7 (green) and control (+/+, blue) mice. Mean ± SD; n=5 vehicle +/+ and 6 F7/F7 mice; n=6 ancrod-treated +/+ and 5 ancrod-treated F7/F7 mice; n=5 TXA-treated +/+ and F7/F7 mice; n=5 F7/F7; Fga+/+, F7/F7; Fga+/-, F7/F7 + scrambled siRNA, and F7/F7 + Plg siRNA. (d) The Ktrans capillary permeability constant in the CC of 12-week old F7/F7 (green) and littermate control (+/+, blue). Values were generated from dynamic contrast-enhanced MRI scans. Mean ± SD; n=6 vehicle +/+ and F7/F7 mice; n=6 ancrod-treated +/+ and F7/F7 mice; n=5 TXA-treated +/+ and F7/F7 mice; n=6 F7/F7; Fga+/+, F7/F7; Fga+/-, F7/F7 + scrambled siRNA, and F7/F7 + Plg siRNA. (e, f) High-resolution T2*-weighted images (sagittal plane) of iron-containing hemosiderin deposits (red dots) in the CC of 12-week old F7/F7 mice treated with ancrod, TXA or vehicle, crossed with Fga+/- compared to littermate Fga+/+ control mice, and treated with scrambled siRNA or Plg siRNA (e), and quantification of hemosiderin deposits in the CC of 12-week old F7/F7 (green) and control (+/+, blue) mice (f). Mean ± SD; n=6 vehicle +/+ and F7/F7 mice; n=6 ancrod-treated +/+ and F7/F7 mice; n=5 TXA-treated +/+ and F7/F7 mice; n=6 F7/F7; Fga+/+, F7/F7; Fga+/-, F7/F7 + scrambled siRNA, and F7/F7 + Plg siRNA. (g) The blood flow values in the CC of 12-week old F7/F7 (green) and littermate control (+/+, blue) mice generated from dynamic susceptibility-contrast MRI scans. Mean ± SD; n=6 vehicle +/+ and F7/F7 mice; n=6 ancrod-treated +/+ and F7/F7 mice; n=5 TXA-treated +/+ and F7/F7 mice; n=6 F7/F7; Fga+/+, F7/F7; Fga+/-, F7/F7 + scrambled siRNA, and F7/F7 + Plg siRNA. (h) Total white matter volume in the CC of 12-week old F7/F7 (green) and littermate control (+/+, blue) mice. Values were generated from diffusion tensor imaging MRI scans. Mean ± SD; n=6 vehicle +/+ and F7/F7 mice; n=6 ancrod-treated +/+ and F7/F7 mice; n=5 TXA-treated +/+ and F7/F7 mice; n=6 F7/F7; Fga+/+, F7/F7; Fga+/-, F7/F7 + scrambled siRNA, and F7/F7 + Plg siRNA. (i) Quantification of Olig2-positive cells in the CC of 12-week old F7/F7 (green) and littermate control (+/+, blue) mice. Mean ± SD; n=5 mice per group. All data were compared by one-way ANOVA and Bonferroni's post hoc; ns=non-significant (p>0.05).
