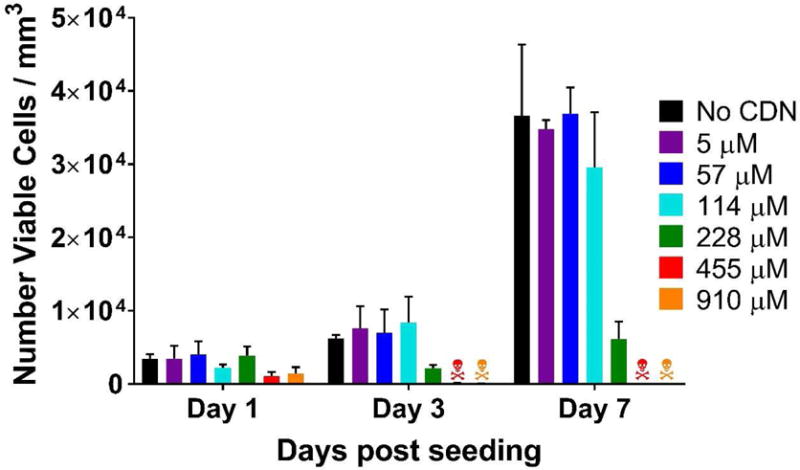
Fig. 4.

Live/dead viability assay quantification used to assess CDN toxicity to MOC2-E6E7 cells. The graph shows the number of viable cells per mm3 of hydrogel over days 1–7 post seeding with cells, testing increasing concentrations of CDN loaded into the MDP hydrogel. The
 symbols refers to >99% cell death. Values represent the mean and standard deviation in all plots (n = 3).
