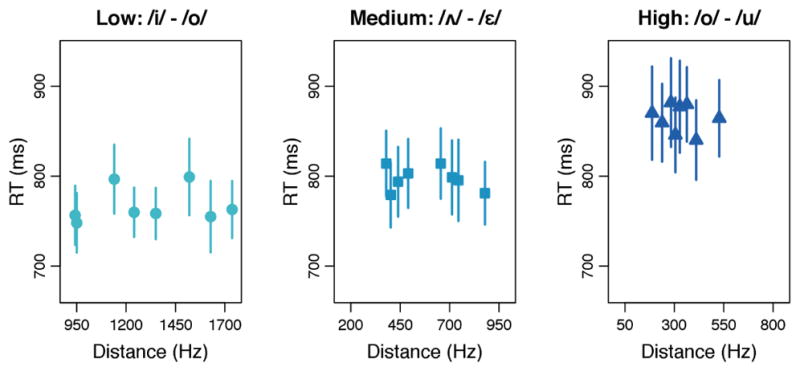
Figure 6. Acoustic distinctiveness of individual tokens and average response times to them.

The distinctiveness of individual tokens was measured as the Euclidean distance within F1×F2 space between each token of one category and the centroid of the contrasting category. Each point is the average response time across participants for each token. Error bars represent the standard error of mean. Within each condition, the acoustic distinctiveness of individual tokens did not have a significant effect on response times.
