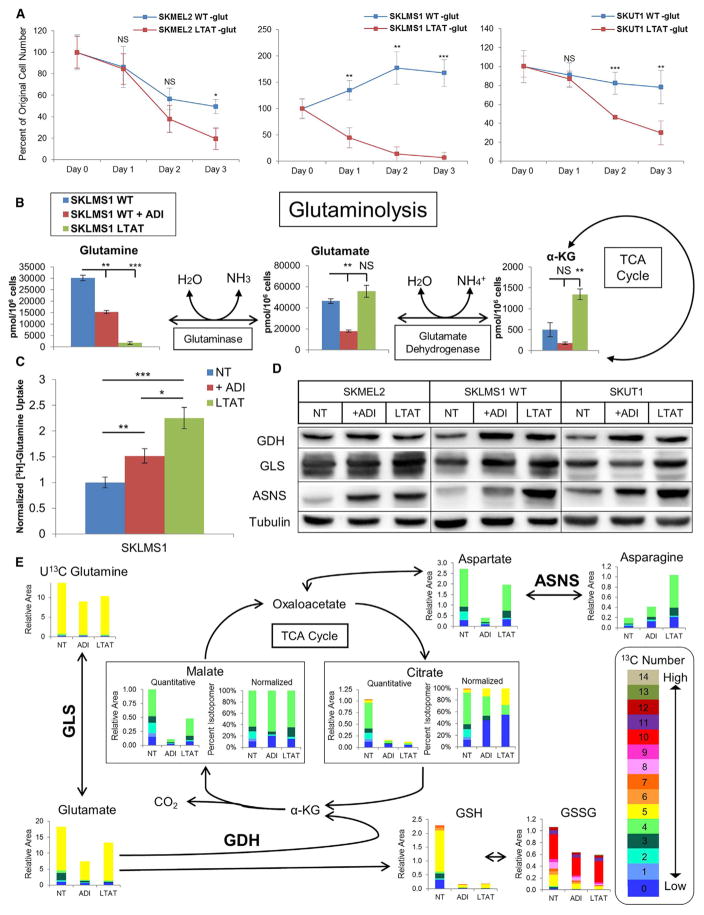
Figure 4. Glutamine Metabolism after Arginine Deprivation.
(A) Normalized viable cell counts of WT and LTAT cell lines grown in glutamine-free medium after 24, 48, or 72 hr (n = 3). Data are represented as mean ± SD.
(B) Metabolite levels in SKLMS1 WT NT, WT + ADI-PEG20, and LTAT cell lines (n = 2). Data are represented as mean ± SD.
(C) Normalized measurements of [3H]-Gln uptake after short- and long-term ADI-PEG20 treatment (n = 12). Data are represented as mean ± SEM.
(D) Immunoblot analysis of enzymes involved in glutamine metabolism and asparagine biosynthesis upon treatment with ADI-PEG20 (representative of n = 3).
(E) Average relative and normalized isotopomer abundance from stable isotope tracing of U13C glutamine in SKLMS1 WT NT, WT + ADI-PEG20, and SKLMS1 LTAT cells (n = 3).
*p < 0.05, **,p < 0.01, ***p < 0.001. See also Figures S4 and S5.

