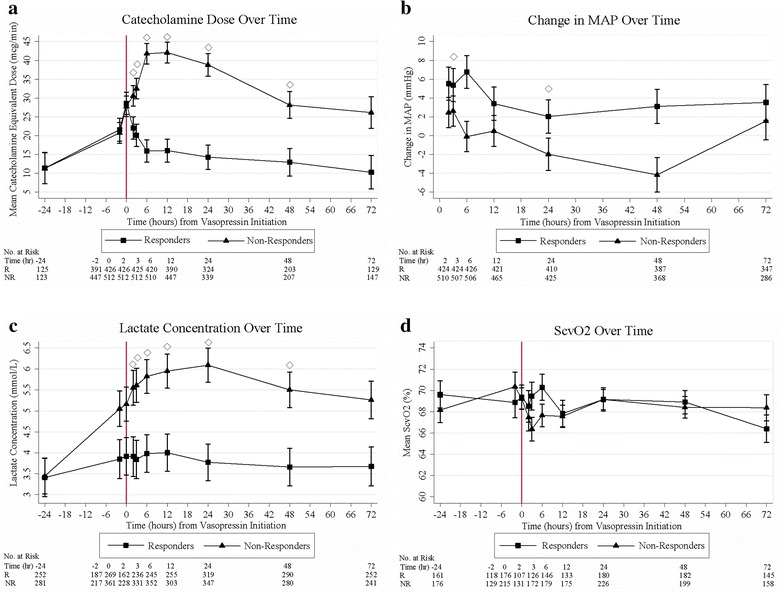
Fig. 2.

Patient results over time for vasopressin responders and non-responders. a Catecholamine dose from -24 h to 72 h after vasopressin initiation. Responders had significantly lower catecholamine doses at 2, 3, 6, 12, 24 and 48 h after vasopressin initiation compared to non-responders. b Change in MAP from time 0 to 72 h after vasopressin initiation. Responders had significantly higher degrees of MAP change at 3 and 24 h after vasopressin initiation compared to non-responders. c Changes in lactate concentration from -24 h to 72 h after vasopressin initiation. Responders had significantly lower lactate concentrations at 2, 3, 6, 12, 24, and 48 h compared to nonresponders. d ScvO2 from -24 h to 72 h after vasopressin initiation. There was no difference in ScvO2 between responders and non-responders at any time point evaluated. MAP mean arterial pressure; NR non-responders; R responders; ScvO2 central venous oxygen saturation. Data are means, with error bars indicating standard deviation. ◊ P < 0.001
