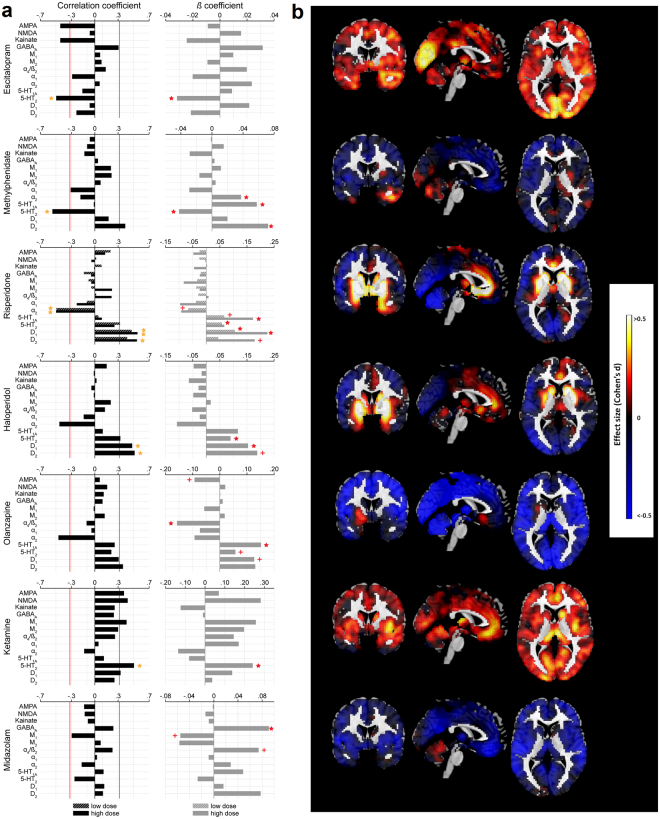
Figure 2.
Results of Pearson correlation, multiple linear regression and effect size analyses. (a) Results of Pearson correlation (left) and multiple linear regression analyses between receptor densities and CBF changes are displayed as bar plots. For drugs with only one evaluated dose the drug profiles are colored as “high dose”. Red line for Pearson correlation plots indicates significance at an uncorrected two-sided p < 0.05 and yellow star indicates significant Bonferroni corrected findings, For multiple linear regressions a plus indicates a marginally significant (p < 0.1) and red star a significant (p < 0.05) effect of the corresponding regressor. (b) Voxel-wise effect size maps (Cohen’s d) are displayed for drug treatments matching the order of drugs displayed in (a). For risperidone the outcomes for the high dose are displayed.

