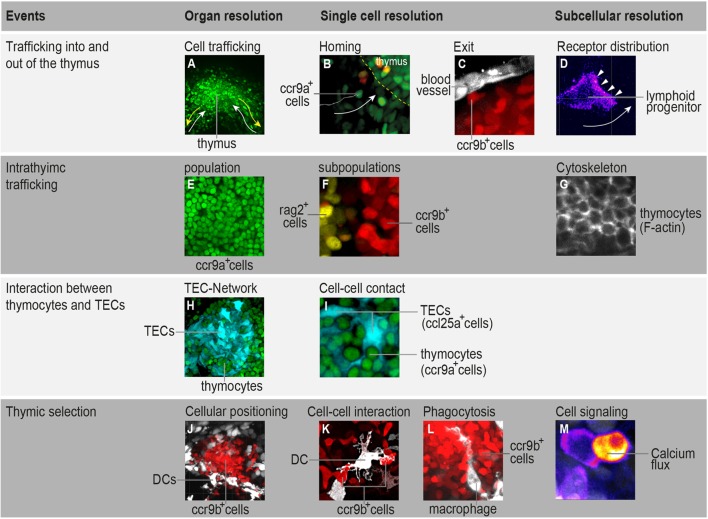
Figure 1.
Highlighting the possibilities that in toto imaging of transgenic medaka fish can provide in studying spatial and temporal aspects of T-cell development. (A) Three-dimensional rendering of a thymus illustrating the trafficking of ccr9a-expressing cells (green) in the extrathymic region. White arrows indicate migration paths of thymus colonization. Yellow arrows indicate emigration paths of cells into the periphery. (B) Still photograph from a time-lapse recording illustrating the migration of ccr9a-expressing cells (green) into the thymus. Yellow dashed lines demarcate the ventral side of the thymus (z = 1 µm). (C) Still photograph from a time-lapse recording illustrating the migration of ccr9b-expressing mature thymocytes (red) toward a blood vessel (white). (D) Still photograph from a time-lapse recording illustrating the migration of a lymphoid progenitor toward the thymus. Note that thymocytes carry a green fluorescent protein (GFP) reporter fused to the Ccr9a chemokine receptor. Arrowheads indicate the accumulation of Ccr9a-GFP protein at the leading edge of the cell. Fluorescence signals are shown as a heat map. (E) One frame (z = 1 µm) from a Z-stack spanning the entire thymus (A) showing that the resolution of in toto imaging permits single thymocytes within the thymus to be distinguished. (F) One frame (z = 1 µm) from a Z-stack spanning the entire thymus illustrating the positioning of rag2-expressing thymocytes (yellow) in the cortex and ccr9b-expressing mature thymocytes (red) in the thymic medullary region. (G) One frame (z = 1 µm) from a Z-stack spanning the entire thymus of transgenic fish carrying a Lifeact reporter, a marker used to visualize F-actin (53). (H,I) Overview and higher magnification of a thymus in a double-transgenic [ccl25a:tagRFP (cyan); ccr9a:h2b-gfp (green)] fish. (H) Three-dimensional rendering of the entire thymus, illustrating the thymic epithelial cell (TEC)-network. (I) One frame (z = 1 µm) from a Z-stack spanning the entire thymus (H) showing that several thymocytes are in close contact with thymic epithelial cells (TECs). Note that ccl25a is expressed in TECs. (J–L) Overview and higher magnification of thymus in a double-transgenic [cxcr3a:gfp (white); ccr9b:tagRFP (red)] fish. (J) Three-dimensional rendering of the thymic medullary region showing that resident dendritic cells (DCs) are predominantly located in the interface between the thymic cortex and medullary region. (K) One example of the interaction of a DC (white) with a ccr9b-expressing mature thymocyte (red). (L) One example of a DC (white) engulfing a ccr9b-expressing thymocyte (red). (M) Still photograph from a time-lapse recording illustrating the rise of intracellular calcium in a thymocyte after interaction with an antigen-presenting cell. Thymocytes carry a GCaMP6s reporter for monitoring calcium level. Fluorescence signals are shown as a heat map. Information regarding transgenic reporters and imaging technique have been described previously (42).

