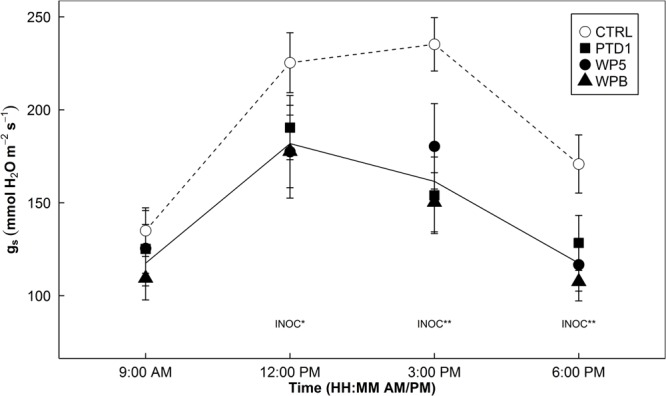
FIGURE 1.

Diurnal patterns of stomatal conductance (gs) of rice leaves on 163 days after germination in a greenhouse bench experiment (Experiment 1). Open symbols indicate mean gs of control groups, whereas closed symbols indicate mean gs of single strain-inoculated groups (square/circle/triangle = PTD1/WP5/WPB, individually). Error bars of the means represent ± 1 SE of replicated samples (n = 10). Single strain endophyte inoculation effect (INOC) is provided at P < 0.05 (∗), 0.01 (∗∗) levels. Contrast matrix was used to test CTRL vs. INOC (PTD1/WP5/WPB nested) comparison. Dotted and solid lines highlight mean responses of CTRL and INOC plants over time.
