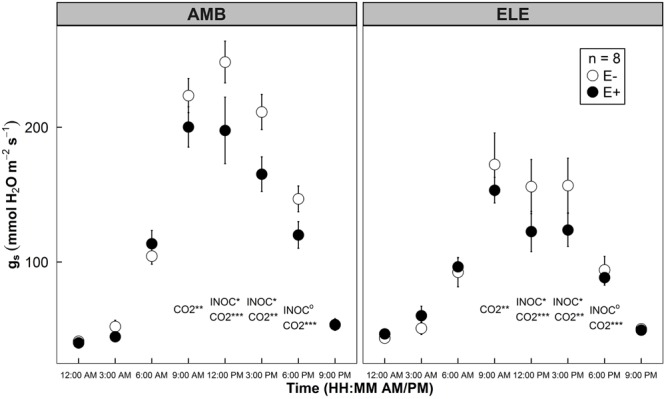
FIGURE 5.

Diurnal patterns of stomatal conductance (gs) of rice leaves grown under two atmospheric CO2 conditions: ambient (AMB, app. 400 ppm on the left panel) and elevated (ELE, app. 800 ppm on the right panel) in a sunlit chamber experiment (Experiment 2). Open symbols indicate mean gs of control groups (E–), whereas closed symbols indicate mean gs of WP5 inoculated groups (E+). Error bars of the means represent ± 1 SE of replicated samples (n = 8). Two-way ANOVA test results are indicated at each time point. CO2 treatment effect (CO2) and endophyte inoculation treatment effect (INOC) are provided at P < 0.10 (o), 0.05 (∗), 0.01 (∗∗), 0.001 (∗∗∗) levels.
