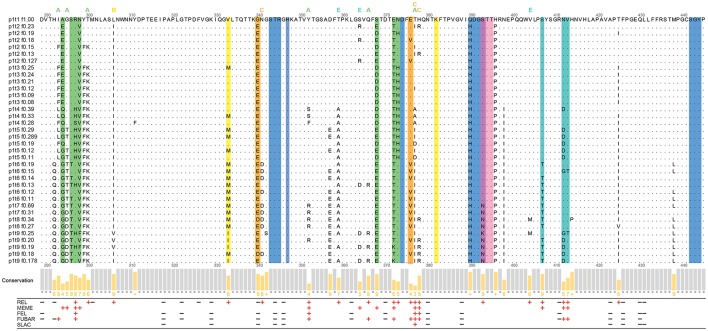
Figure 4.
Analysis of the partial P-domain alignment of the haplotypes (residues 289–445). Commonly defined epitopes and HBGA binding sites are highlighted as the colored columns. Green, epitope A; yellow, epitope B; orange, epitope C; pink and violet, epitope D; cyan, epitope E; blue and violet, HBGA binding sites. The sites within the 8-Å expanded area of the epitopes are indicated with letters above the alignment, colored as for the epitopes. The Jalview histogram below the alignment indicates the conservation of the physico-chemical properties for each column (lower bars with lower numbers, lower conservation; completely conserved columns are in gray). The positive and negative selection pressures defined through the Datamonkey algorithms are shown as red plus and black minus signs, respectively.

