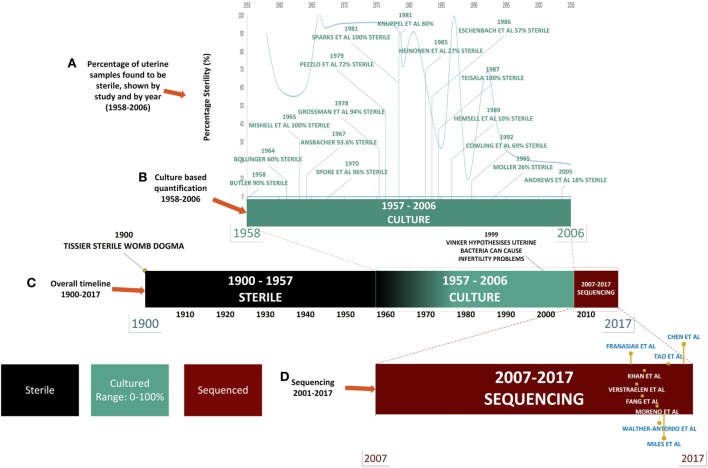
Figure 1.
Timeline of uterine microbiota reports in the literature. Color legend: black denotes time periods in which the uterus was considered sterile, green indicates the time period during which culture-based techniques were used, and red indicates the uses of high-throughput sequencing techniques. (A) From 1958 to 2006: literature detailing culture-based methods of quantification of the uterine microbiome (shown in green). (B) The decline in the perceived sterility of the endometrial microbiome according to literature reported over time. (C) Overall timeline from 1900 to 2017 [from assumption of sterility of uterine microbiome to detailed quantification of bacterial species through next-generation sequencing (NGS)]. (D) NGS: 2007–2017 (shown in red) uterine microbiome literature that has been published to date utilizing this technology.

