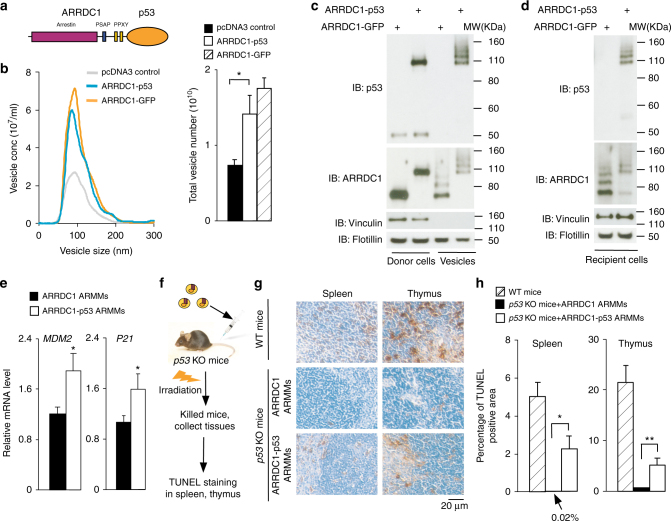
Fig. 1.
Packaging and in vivo delivery of p53 protein via ARMMs. a Schematic showing p53 fused to the C-terminus of ARRDC1. Domains and motifs in ARRDC1 relevant to ARMMs budding are indicated. b Effect of ARRDC1-p53 expression on the production of EVs. pcDNA3, ARRDC1-GFP, or ARRDC1-p53 construct was transfected in HEK293T cells. EVs in the media were analyzed by the NanoSight NS300 instrument (left graph). Numbers of EVs from 3 independent experiments were quantified (right graph). Data were presented as the mean ± SEM. c Packaging of ARRDC1-p53 into ARMMs. pcDNA3, A1-GFP, or A1-p53 was transfected in the production of HEK293T cells. EVs in medium were pelleted vesicles by ultracentrifugation. Western blotting for p53, ARRDC1, and control protein vinculin was done on both cell lysates and EVs. d Transfer of ARRDC1-p53 fusion protein in ARMMs to recipient cells. Purified ARMMs containing ARRDC1-GFP or ARRDC1-p53 were incubated with H1299 cells overnight. The cells were washed with PBS extensively and subjected to Western blot analysis. e Induction of p53 target genes by ARRDC1-p53 fusion protein delivered via ARMMs. ARRDC1- or ARRDC1-p53 ARMMs were incubated with H1299 cells for 48 h. Total RNAs were extracted from the cells and used for qRT-PCR to measure MDM2 and p21 mRNA expression. Data were presented as the mean ± SD. The experiments were repeated for five times. f Schematic of in vivo delivery strategy. Control or ARRDC1-p53 ARMMs were injected in the tail veins of p53 knockout (KO) mice, which were then subjected to DNA ionizing radiation. Irradiation-sensitive tissues such as thymus and spleen were harvested for TUNEL staining. g Representative images of TUNEL staining of spleen and thymus from wild type mice or p53 KO mice injected with indicated ARMMs. 2-month old mice (n = 3–4 for each condition) were injected with A1 or A1-p53 ARMMs and 36 h later subjected to irradiation. Age-matched WT animals were used as positive controls for irradiation treatment. Scale bar for the images are shown. h Quantification of apoptotic (TUNEL-positive) cells in tissue staining images. Data were presented as mean ± SEM. *p < 0.05; **p < 0.01

