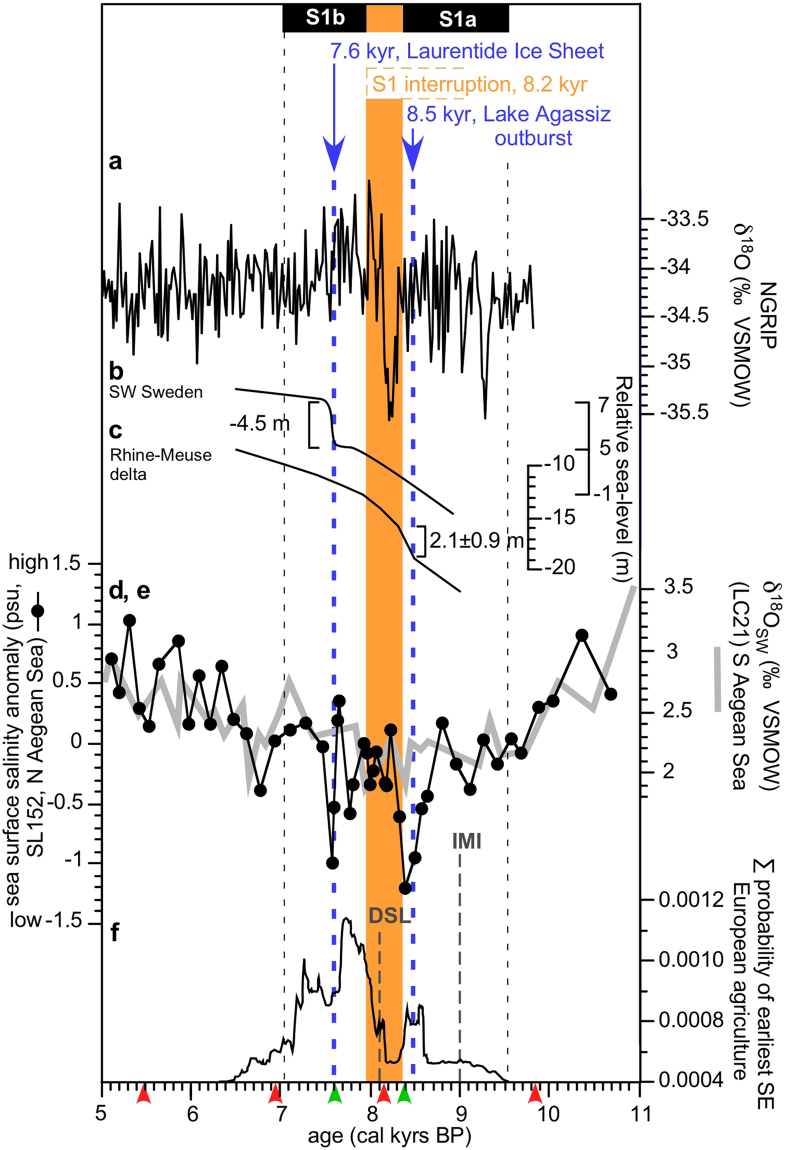
Figure 2.
Timing of sea-level and sea surface salinity variation, and the establishment of Neolithic farmers across southeastern Europe during the Holocene. (a) δ18O record of the North Greenland ice-core36. (b) Relative sea-level changes in southwestern Sweden. (c) Relative sea-level change of the Rhine-Meuse-Delta2. (d) Northern Aegean Sea surface salinity (SSS) anomaly of Site GeoTÜ SL152 in practical salinity units (psu). (e) δ18Oseawater record from core LC21 as an indicator for fresher sea surface conditions in the southern Aegean Sea14. (f) Summed probability of earliest southeastern European agriculture21,28. Thin, black dashed lines indicate the duration of the sapropel 1 (S1b, S1a). The yellow bar is the interruption of the sapropel formation between about 8.0 and 8.4 kyrs cal BP in core GeoTÜ SL152. The blue dashed lines at ~7.6 and ~8.4 kyrs cal BP indicate the main phases of freshwater outburst from Lake Agassiz and the decay of the Laurentide ice sheet in North America. The grey dashed lines at 9.0 and 8.1 kyrs cal BP represent the Initial Marine Inflow (IMI) and Disappearance of the Lacustrine Species (DSL) in the Black Sea17. Small arrows indicate AMS dating points (green, this study and red literature data9 of core GeoTÜ SL152, see Method section and Supplement Table 1 and Fig. 3 for further explanations of our revised age model of GeoTÜ SL152).

