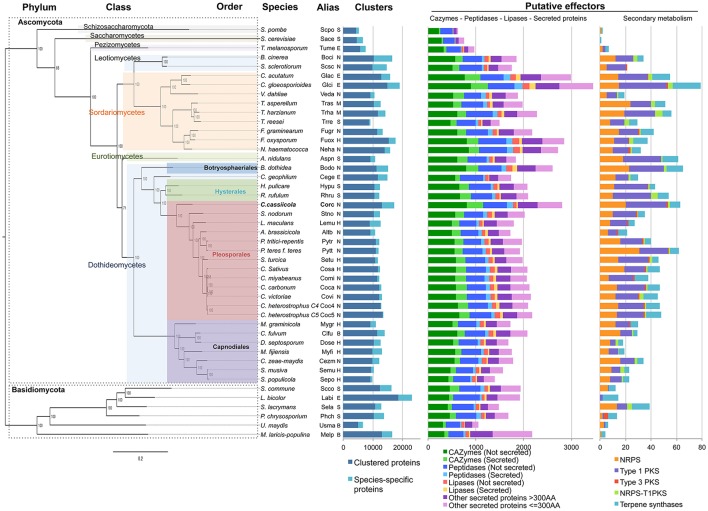
Figure 2.
Interspecific phylogenomic tree, protein clusters and putative effectors of 45 fungal species. Details of the species and their genome access links are listed in Table S1. Life styles are indicated by a letter: S, saprotrophic; N, necrotrophic; H, hemibiotrophic; B, biotrophic; E, ectomycorrhizal. The maximum likelihood phylogenetic tree was based on 651 concatenated core protein sequences. Branch lengths are indicated by the bar (substitutions/site); 1,000 bootstrap values are shown as percentages. Clustered and non-clustered (species-specific) protein numbers were predicted based on OrthoMCL clustering. Putative effectors: number of gene models encoding CAZymes, peptidases, lipases and other secreted proteins (left diagram), or involved in the secondary-metabolism (NRPS, PKS, terpenes synthases, right diagram).

