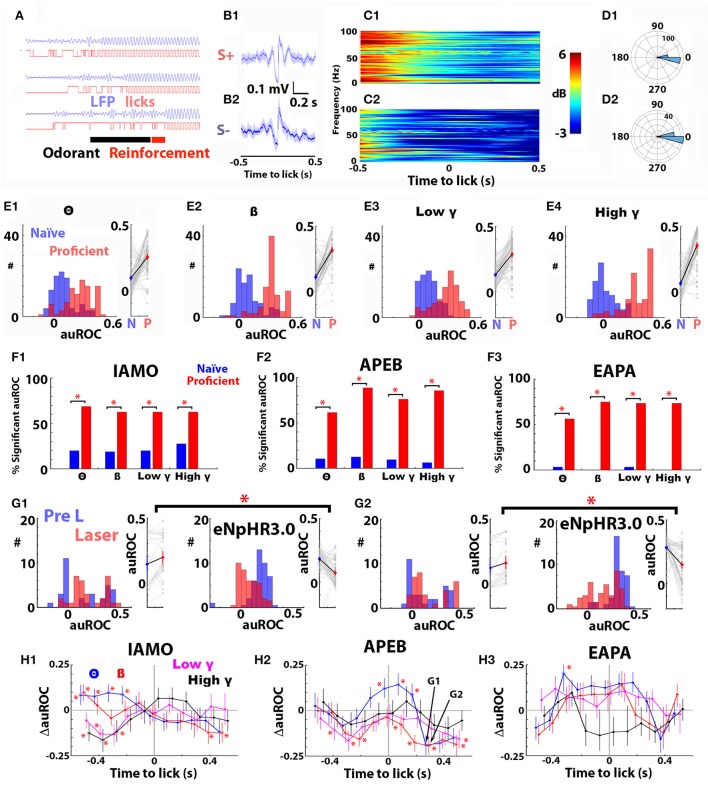
Figure 7.
Optogenetic silencing of norepinephrine axons in the olfactory bulb elicits statistically significant changes in the auROC for the odorant-elicited change in power of the lick-related LFP (Δ power LR-LFP). (A) Examples of traces showing phase locking of the theta LFP filtered at 6–12 Hz with licks for three trials when the animal was proficient in differentiating odorants for the APEB odorant pair in the go-no go task. Licks were detected as an increase in voltage elicited when the tongue touched the lick spout. The black bar shows the duration of odorant application (2.5s). (B) Mean LFP and 95% confidence intervals, computed by bootstrapping, recorded when the LFP was triggered by the onset of the lick, for all licks occurring for 2 s after odorant application for 30 trials for the mouse whose raw traces are shown in (A) (B1, S+, B2 S–). The lick-locked LFP is shown for the time interval from −0.5 to 0.5 s centered at lick onset (lick-related LFP, LR-LFP). (C) Spectrogram for the odorant-induced change in LR-LFP power for S+ (C1) and S– (C2) for these 30 trials. (D) Theta LFP phase of the lick onset for S+ (D1) and S– (D2) for these 30 trials. (E1–E4) The auROC for Δ power LR-LFP computed for 30 S+ and S– trials increases for all bandwidths between the first 30 trials of the first go-no go training session (naïve, blue) and the last 30 trials of the last training session (proficient, red) for animals learning to discriminate the APEB odorant pair. (A1) theta, (A2) beta, (A3) low gamma, (A4) high gamma. For each panel a histogram of auROC values is shown on the left, and a scatter plot is shown on the right. For all bandwidths the p-value for a permuted N-way ANOVA testing for the difference in auROC between naïve and proficient was <0.0001, pFDR = 0.05 (9 mice, 16 electrodes each). (F1–F3) The percent of significant auROCs for Δ power LR-LFP computed for 30 S+ and S–trials increases for all bandwidths between the first 30 trials of the first go-no go training session (naïve, blue) and the last 30 trials of the last training session (proficient, red) for animals learning to discriminate the IAMO (F1), APEB (F2), and EAPA (F3) odorant pairs (percent significant auROC is shown for all bandwidths). The number of significant auROCs differed between naïve and proficient trials for all odorant pairs and all bandwidths when tested with a Chi Squared test (p < pFDR = 0.05, number of mice 7 for IAMO, 9 for APEB, and 9 for EAPA, 16 electrodes per mouse). (G) Examples of the effect of optogenetic silencing of the noradrenergic fibers in the OB on the Δ power LR-LFP auROCs calculated with Hits and CRs for the last 30 trials in the session where the animal was proficient in differentiating odorants for the APEB odorant pair (Pre L, blue) and the first 30 trials in a subsequent session where light was applied for 3.5 s starting when the animal entered the port (Laser, red). Shown are the histograms (left) and scatter plots (right) for Δ power LR-LFP auROCs for theta (G1) and beta (G2) bandwidths before (Pre L, blue) and during (Laser, red) laser stimulation for the APEB odorant pair. Data are shown for DBH-Cre mice (C1,C2, left, n = 4, 16 LFP electrodes each) and DBH-Cre eNpHR3.0 mice (C1,C2, right, n = 6, 16 LFP electrodes each). The auROC in panels (C1,C2) was calculated using LR-LFP Δ power recorded in Hit and CR trials 0.3 s after the onset of the lick. The interaction term of an N-way ANOVA with mouse genotype and laser stimulation as the two factors was significant for the Hit/CR auROC for both (C1,C2) (p ≤ 0.0001, <pFDR = 0.022). H. Difference between genotypes of the change in auROC elicited by optogenetic silencing of local noradrenergic fibers (ΔauROC = change in auROC for DBH-Cre eNpHR3.0 mice—change in auROC for DBH-Cre mice). Shown are the mean and the estimate of the 95% confidence intervals for the ΔauROC for all bandwidths for IAMO (H1), APEB (H2), and EAPA (H3). Data for the different bandwidths are shown in different colors: theta (blue), beta (red), low gamma (purple), and high gamma (black). The LR-LFP Hit/CR auROC was computed as shown for examples in panel (G). In H2 arrows points to ΔauROC data points corresponding to the data shown in panels (G1) (theta, APEB) and (G2) (beta, APEB). Asterisks denote ΔauROCs found to be significant for the interaction term of an N-way ANOVA with mouse genotype and laser stimulation as the two factors (p ≤ pFDR, pFDR = 0.015 for IAMO, 0.022 for APEB and 0.001 for EAPA, the number of DBH-Cre mice was 5 for IAMO, 4 for APEB, and 8 for EAPA and the number of DBH-Cre eNpHR3.0 mice was 4 for IAMO, 6 for APEB, and 4 for EAPA, 16 electrodes per mouse).

