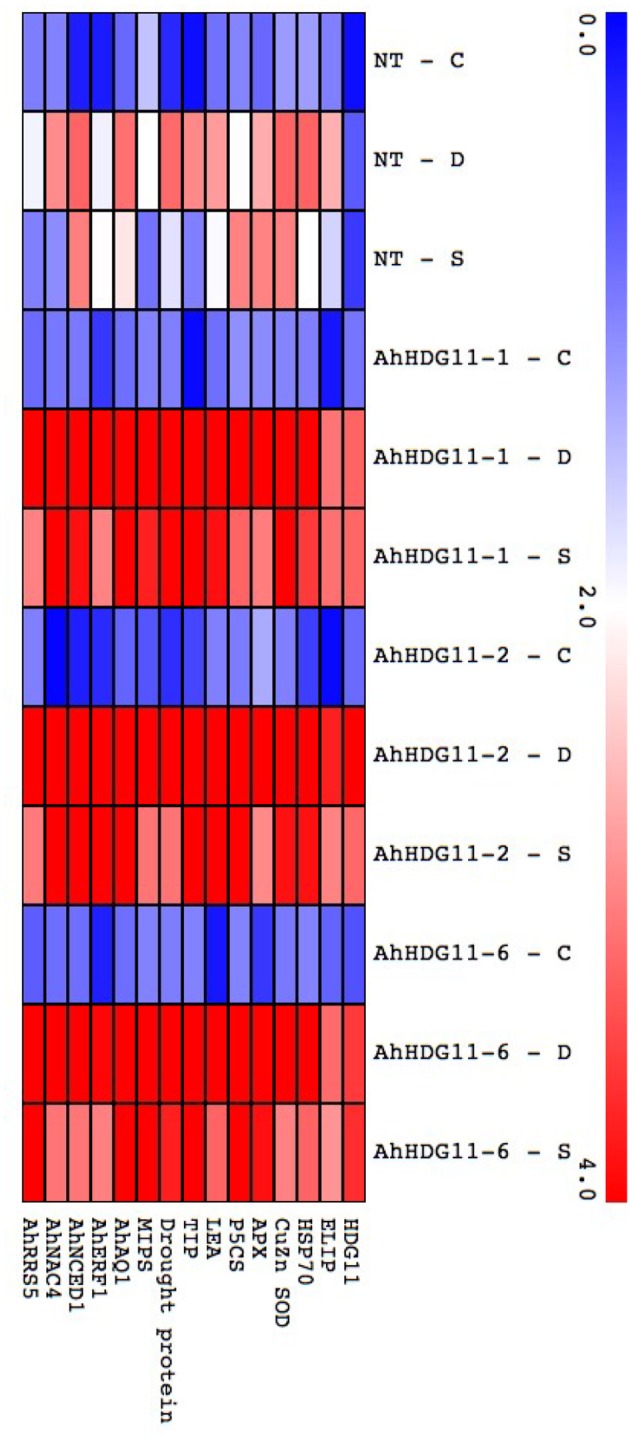
Figure 10.

Gene expression analysis of known stress responsive genes in non-transgenic (NT) and Transgenic lines. qRT-PCR analysis of T3 generation peanut transgenic lines for the expression of known stress responsive genes under induced drought and salt lysimetric experiments. Heat map showing the expression of known stress responsive genes of stress gene network in non-transgenic (NT) and transgenic plants under well-water, drought and salt stress conditions. The log2 fold change scale is indicated in the heat map.
