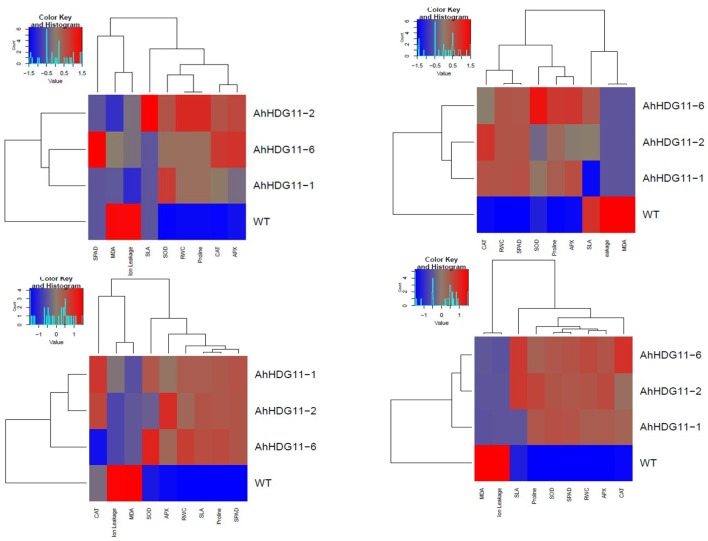
Figure 11.
Overall assessments of physiological and biochemical responses in non-transgenic and transgenic lines during well-water (A), drought stress (B), re-watering (C), and salt stress (D). The relative values of physiological, biochemical parameters for the heat-map analysis. Scale: for the drought and salt tolerance capabilities, from brightest blue equal lowest to brightest red equal highest capabilities; for physiological and biochemical parameters, from brightest blue equals most decreased to brightest red equals most increased.

