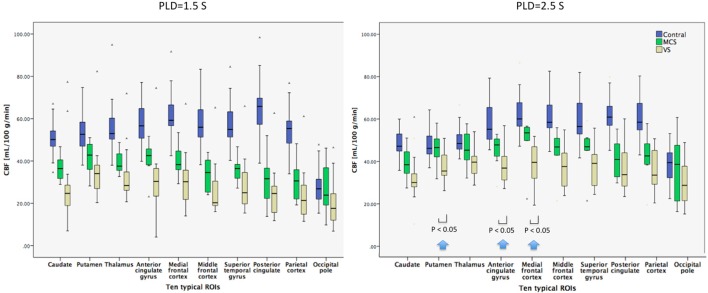
Figure 1.
Box plots displaying 25, median value, 75 (box), and 95% (whiskers) of cerebral blood flow (CBF) value distributions in the 10 typical regions of interest (ROIs) of healthy control subjects, minimally conscious state (MCS) patients, and vegetative state (VS) patients. Compared with VS patients, the regional mean CBF with post-labeled delay (PLD) 1.5 s for MCS patients had a pattern of relatively decreased CBF in most ROIs, but not significantly. As the PLD changed to 2.5 s, the regional mean CBF for MCS had a pattern of significantly increased CBF in the regions including the putamen, anterior cingulate gyrus, and medial frontal cortex (P < 0.05) (as shown by arrows).

