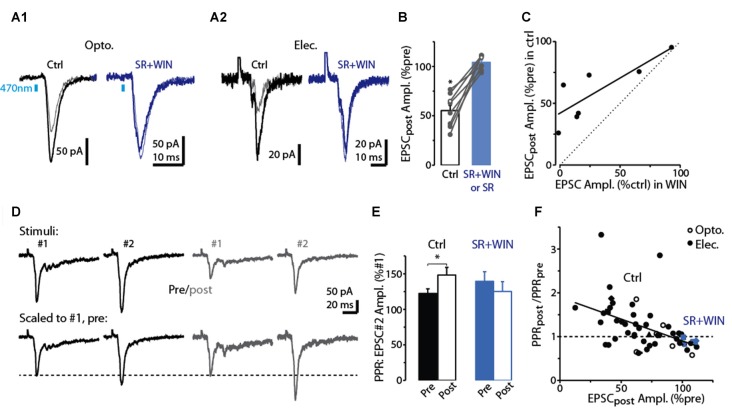
Figure 3.
Evidence for DSE mediated by presynaptic CB1-Rs in dSACs. (A1) Light-evoked CFF-EPSCs recorded from a dSAC prior to (darker traces) and 2.5 s after a 5 s depolarization (lighter traces) under control conditions (left) and in the presence of the CB1-R antagonist SR (right; SR solution contains WIN). Traces reflect means of 3–10 trials. (A2) Results from a second experiment like (A1) except that the CFF-EPSCs were evoked by electrical stimulation in aPC. (B) Summary from eight experiments similar to (A1,A2) showing that SR (n = 4) or SR+WIN (n = 4) fully reverses the effect of the depolarization on the CFF-EPSC. Filled symbols: electrical stimulation; open symbols: light stimulation. *p < 0.02, n = 8. (C) Comparison of the effects of prolonged depolarization of the test dSAC vs. application of the CB1-R agonist WIN on CFF-EPSCs (in the absence of depolarization). Each data point reflects one of seven recordings in which both were monitored. Line: linear regression fit, R2 = 0.67, p < 0.02, n = 7). Dotted line: unity. (D) CFF-EPSCs in a dSAC evoked by paired electrical stimulation recorded before (left, darker traces) and 2.5 s after (right) a 5-s depolarization. Top traces: averages of 10 trials; bottom: same traces scaled to the peak amplitude of the first EPSC. Note the increase in PPR for EPSCs evoked following the depolarization. The two-stimulus bursts used to estimate PPR before and after the depolarization were separated by 250 ms in these experiments. (E) Summary of effects of prolonged depolarization on PPR. Results reflect 43 experiments in which PPRs were measured before and after the depolarization under control conditions (left) and four experiments in which the same measurements were made in SR+WIN (right). *p = 0.012 in paired t-test, n = 43. (F) The effect of the 5-s depolarization on PPR of the CFF-EPSCpost (Y-axis: “PPRpost /PPRpre”) was correlated with its effect on the peak amplitude of the first EPSC. Each data point reflects a single experiment (averages of 3–23 trials) conducted under control conditions (black points) or in SR+WIN (blue points). Line: linear regression of the combined control and SR+WIN data (R2 = 0.23, p < 0.001, n = 43).

