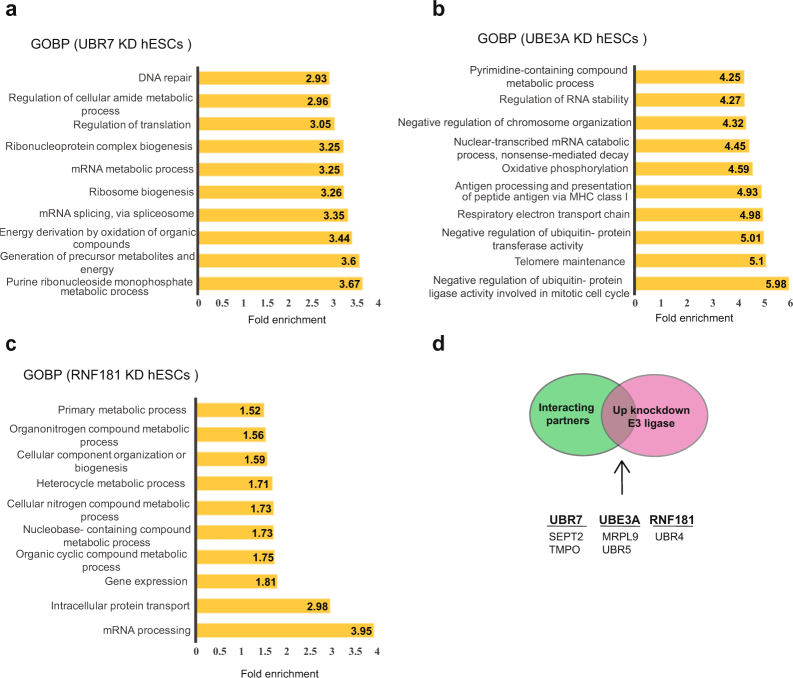
Figure 6.
Loss of distinct up-regulated E3 enzymes induces changes in the hESC proteome. (a) Loss of UBR7 changed the levels of 506 proteins in H9 hESCs (FDR <0.2 was considered significant, n = 3). GOBP analysis (P < 0.05) revealed a strong enrichment for regulators of the purine metabolic process as well as generation of energy and metabolites. (b) Loss of UBE3A changed the levels of 661 proteins in H9 hESCs (FDR < 0.2 was considered significant, n = 3). Bar graph representing the top GOBPs changed upon UBE3A KD (P < 0.05). (c) Loss of RNF181 changed the levels of 202 proteins in H9 hESCs (FDR < 0.2, n = 3). Bar graph representing the top GOBPs changed upon RNF181 KD (P < 0.05). (d) Common proteins between interacting partners of E3 ubiquitin ligases and proteins up-regulated in hESCs with knockdown of the respective E3 enzymes.

