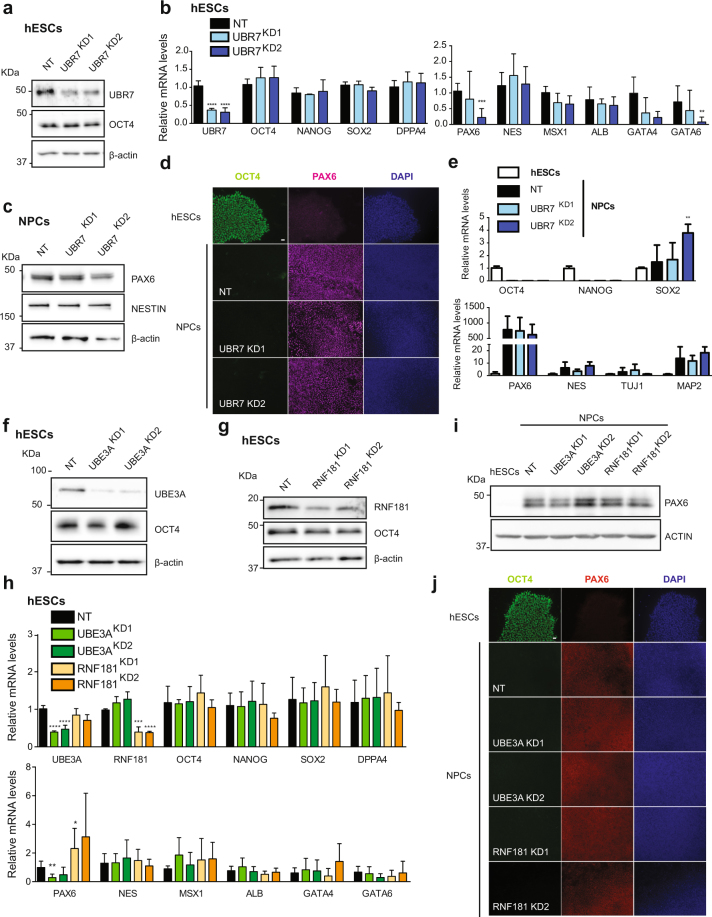
Figure 7.
Loss of UBR7, UBE3A and RNF181 does not affect the expression of pluripotency markers and neural differentiation. (a) Western blot analysis with antibodies to UBR7 and OCT4 comparing non-targeting shRNA (NT) with UBR7 knockdown (KD) H9 hESCs. We used two independent shRNAs to UBR7 (KD1 and KD2, respectively). ß-actin is the loading control. The images are representative of two independent experiments. All cropped blots were run under the same experimental conditions. The original blots are included in Supplementary Fig. 13. (b) Real-time PCR analysis of pluripotency (left panel) and germ-layer markers (right panel) in UBR7 KD H9 hESCs. Graphs (relative expression to NT shRNA) represent the mean ± s.e.m. of four independent experiments. (c) Western blot analysis after 10 days of neural induction of UBR7 KDH9 hESCs. ß-actin is the loading control. The images are representative of two independent experiments. (d) Immunocytochemistry after 10 days of neural differentiation. OCT4, PAX6, and DAPI staining were used as markers of pluripotency, neuroectodermal differentiation, and nuclei, respectively. Scale bar represents 20 μm. (e) Real-time PCR analysis of pluripotency (upper panel) and neuroectodermal markers (lower panel) in UBR7 KD H9 hESCs after 10 days of neural differentiation. Graphs (relative expression to NT) represent the mean ± s.e.m. of three independent experiments. (f,g) Western blots of UBE3A and OCT4 (f) and RNF181 and OCT4 (g) protein levels. ß-actin is the loading control. The images are representative of two independent experiments. (h) Real-time PCR analysis of pluripotency (upper panel) and germ-layer markers (lower panel) in UBE3A and RNF181 KD H9 hESCs. Graphs (relative expression to NT shRNA) represent the mean ± s.e.m. of three independent experiments. (i) Western blot analysis after 10 days of neural induction of UBE3A and RNF181 KD H9 hESCs. ß-actin is the loading control. The images are representative of two independent experiments. (j) Immunocytochemistry after 10 days of neural differentiation. OCT4, PAX6, and DAPI staining were used as markers of pluripotency, neuroectodermal differentiation, and nuclei, respectively. Scale bar represents 20 μm. All the statistical comparisons were made by Student’s t-test for unpaired samples. P-value: *(P < 0.05), **P < 0.01, ***(P < 0.001), ****(P < 0.0001).

