Fig. 1.
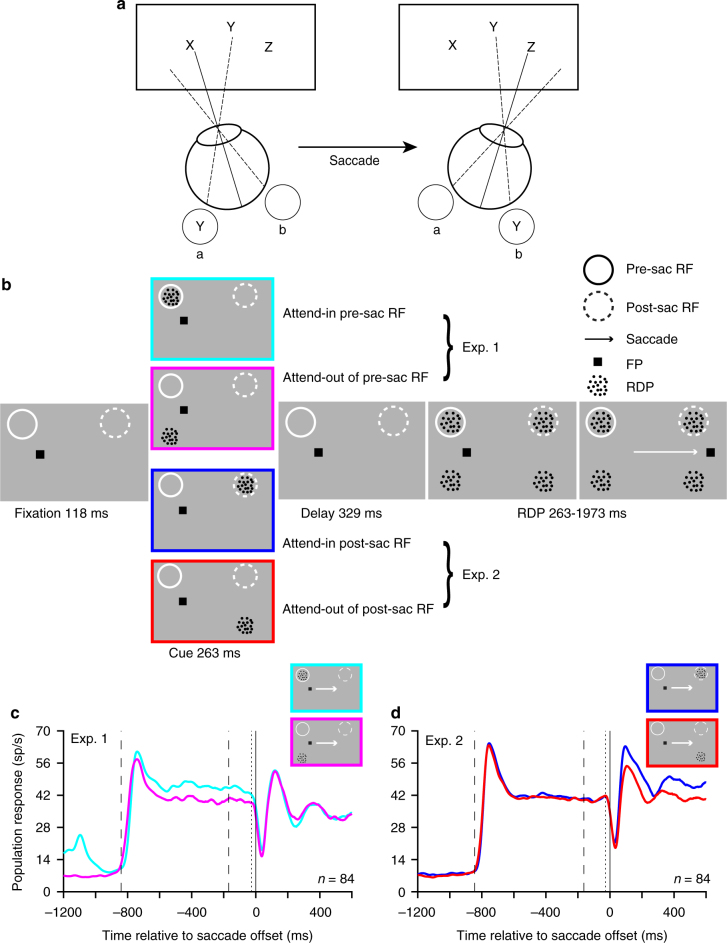
Attention enhances different target populations before and after a saccade. a Cartoon demonstrating that different neurons (retinotopically) represent an attended stimulus across a saccade. Stimulus X is foveated before the saccade and stimulus Z after the saccade. The attended stimulus Y falls in the RF of neurons representing retinal location a before the saccade and in the RF of neurons representing retinal location b after the saccade. b Two rhesus monkeys were trained to covertly attend to one of four moving RDPs (the target) while also making a visually guided saccade if the fixation point (FP) jumped to a new location (after 673 ms). An initial spatial cue marked the target location on each trial. A different RDP appeared in the RF before and after the saccade. In Experiment 1, after the saccade, the stimulus in the RF was always a distractor, while before the saccade, either a target or a distractor appeared in the neuron’s RF; the situation was reversed for Experiment 2. The target change occurred between 263 and 1973 ms after RDP onset. c Population average peri-stimulus time histograms (PSTHs) from 84 neurons in Experiment 1, aligned to saccade offset. Before the saccade, neurons respond more strongly to a target stimulus (cyan curve) compared to a distractor stimulus (magenta curve). PSTHs constructed by filtering the spike-trains with a truncated Gaussian window (15 ms standard deviation, 100 ms filter width) stepping every 1 ms (see Methods). Inset rectangles: cue location for the two conditions. Left to right: first dashed vertical line—mean time of RDP onset, second dashed vertical line—mean time of fixation point jump, dotted vertical line—mean time of saccade onset. The early response before RDP onset in the attend-in condition (cyan curve) is the cue response. Data are pooled from both monkeys. d PSTHs for Experiment 2; 84 neurons. After the saccade, neurons respond more strongly to a target stimulus (blue curve) compared to a distractor stimulus (red curve)

