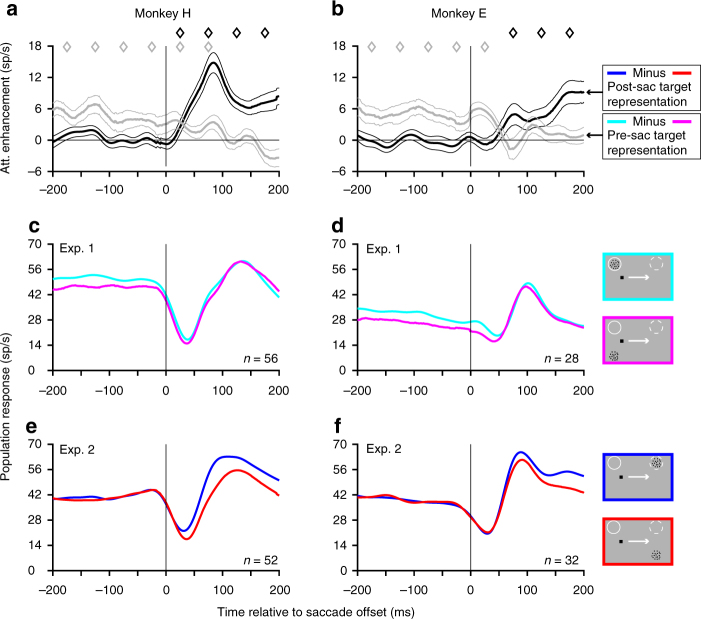
Fig. 2.
The trans-saccadic attention shift is well synchronized to the saccade. a, b The attentional cross-over time (when the attentional enhancement of the post-saccadic target representation becomes larger than the attentional enhancement of the pre-saccadic target representation) occurs at 29 ms (a, monkey H) and 53 ms (b, monkey E) after saccade offset. Data are for monkey H in a and for monkey E in b. Gray and black curves show the mean difference (and s.e.m) between the target-in-RF and distractor-in-RF curves in Experiment 1 and Experiment 2, respectively (as shown in c–f). Diamonds above the curves indicate the successive, non-overlapping 50 ms time-bins in which the differences are significantly larger than zero (one-sided t-test): black diamonds for the black curve and gray diamonds for the gray curve. c–f Same data as in Fig. 1b (c, d) and Fig. 1c (e, f), but plotted separately for the two monkeys and focusing on the time around the saccade (−200 to 200 ms relative to saccade offset); format otherwise identical. The gray curves in a and b are computed as the difference between the cyan and magenta curves in c and d, respectively, while the black curves in a and b are computed as the difference between the blue and red curves in e and f, respectively. Also see Supplementary Fig. 1

