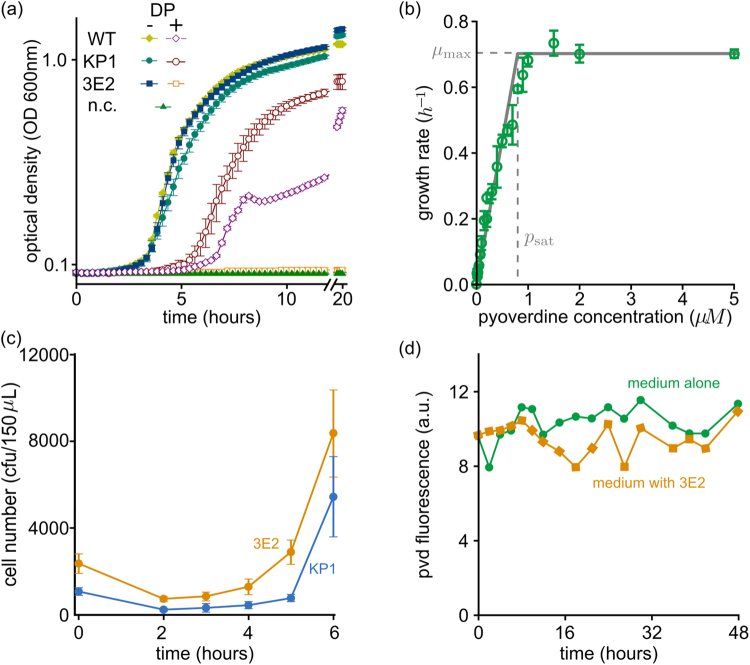
Figure 3.
Characterization of the social impact of pyoverdine (PVD) in terms of costs (a), benefits (b), degree of sharing among cells (c) and stability (d). (a) In an environment with available iron (KB, solid symbols), non-producer cells (strain 3E2) grows as fast as the wild-type (WT), and faster than the producer (strain KP1). Under extreme iron limitation (KB /1 mM DP, empty symbols), PVD is needed for growth: KP1 and WT grow, whereas 3E2 does not (mean values and standard deviations were calculated from six measurements). (b) Green dots represent the growth rate of 3E2 cultures, measured under extreme iron limitation (KB/1 mM DP) in the presence of the indicated concentrations of added PVD (error bars are standard deviation over four replicates). The solid gray line represents the growth rate calculated using equation (2) (maximal growth rate and the saturation concentration fitted to the experimental data: , = 0.8). (c) Early growth of KP1–3E2 co-cultures (initial fraction of KP1 = 0.33) under extreme iron limitation (KB/1 mM DP). Shown are mean and SD of eight independent experiments. Since 3E2 needs PVD to grow (see panel b), this result indicates that PVD is shared between the strains. (d) Stability of PVD (2 µM) in KB medium and in the presence of the non-producer 3E2. The fluorescence emission was recorded at 460 nm (excitation 400 nm).

