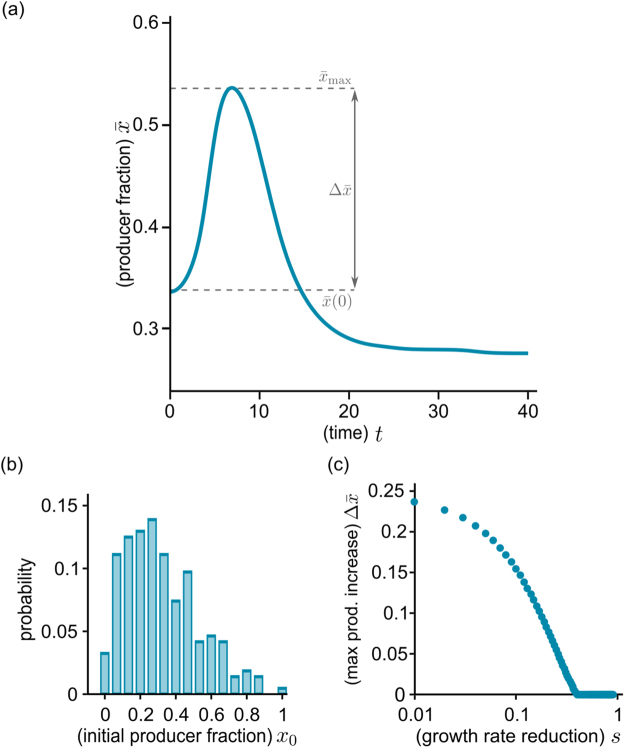
Figure 4.
Simulation results for the growth of a metapopulation. The time course of the global producer fraction (a) is computed by numerically solving equations (4) for a given distribution of stochastic initial compositions (b) (parameter values: = 200, = 0.05, initial size ). The producer fraction initially increases as populations with more producers begin to expand earlier (see also Supplementary Movie S1). After reaching a maximum value , the global producer fraction decreases. (c) The maximal magnitude of the increase decreases with stronger growth reduction ( between 0.01 and 0.9, other parameters identical to panel (a): for low it is comparable to the initial producer fraction, while very low producer growth precludes any increase at all.

