Figure 4.
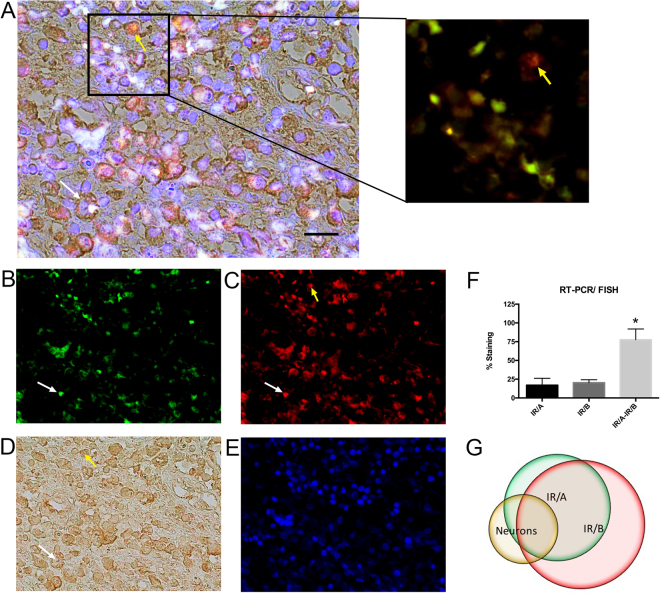
Representative in situ RT-PCR/ FISH for IR/A and IR/B along with MAP2 immunohistochemistry in the frontal cortex of the human brain. (A) FFPE frontal cortex human brain tissue (7 µm) was assayed by RT-PCR/FISH for (B) IR/A (green) and (C) IR/B (red) followed by immunohistochemistry for the neuronal marker (D) MAP2. Sections were mounted with Vectashield containing (E) DAPI (blue) to visualize the nuclei. Breakout of (A) shows the co-localization of the red (IR/A) and green (IR/B) signals and specifically a neuron expressing only the IR/A isoform (yellow arrow). (F) Staining analysis of IR/A (red) and IR/B (green) signal by digital fluorescent microscopy and Squassh. (G) Co-localization analysis of IR/A (green) and IR/B (red) signal with MAP2 (DAB) immunohistochemistry. White arrow indicates co-localization of IR/A, IR/B and MAP2 staining. Yellow arrow indicates co-localization of IR/B only with MAP2 staining. *Indicates statistical significance compared to IR/A or IR/B alone (p < 0.01) using ANOVA with Tukey’s multiple comparison. Scale bar = 25 µm.

