
Figure 2.
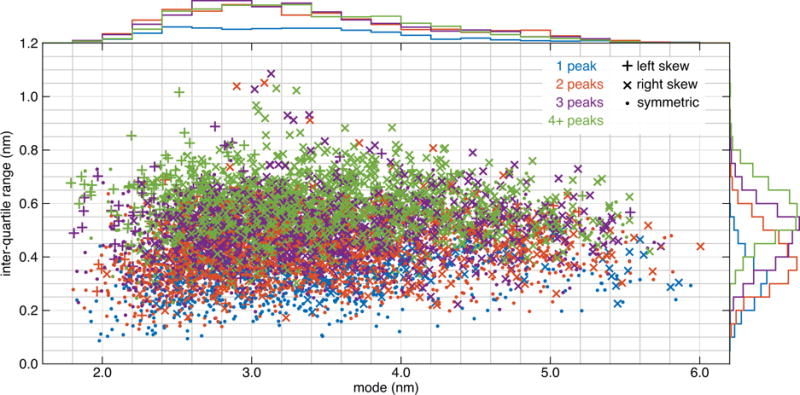
Summary statistics of the 5622 model DEER distance distributions derived from the crystal structure of T4 lysozyme (PDB 2LZM). The inter-quartile range (iqr) of r is plotted vs the mode of r for each distribution. Color indicates the number of peaks (significant maxima), and the symbol indicates the type and degree of skew. The histogram colors correspond to the number of peaks.