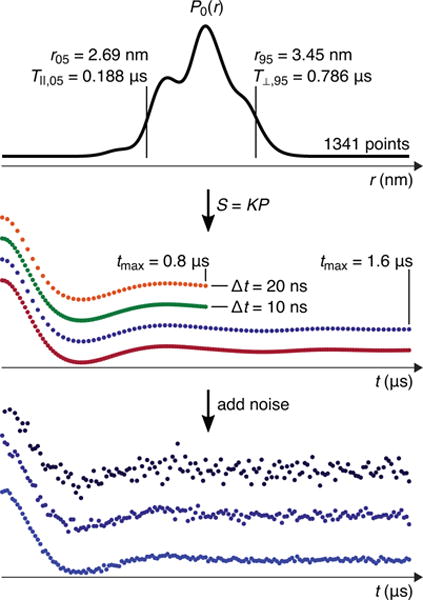
Figure 4.

Generation of time traces (S(t)) from a distance distribution. Top panel: the model distribution (for labeled residues 112 and 143). In this case, 3T⊥,95 = 2.36 μs, so tmax was set to 1.6 and 0.8 μs in accordance with the rules given in Section 3. T‖,05/6 = 31.3 ns, so Δt was set to 10 and 20 ns. Middle panel: the four resulting time-domain traces generated using Eq. (4). Bottom panel: three noisy realizations with σ = 0.1, 0.05, and 0.02 for the 3rd (dark blue) trace in the middle panel. A total of 120 noisy time-domain traces were generated from this particular distribution.
