
Figure 5.
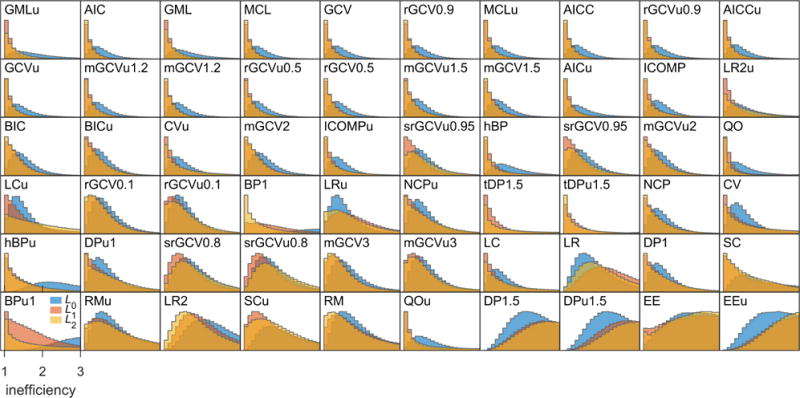
Inefficiency distributions for each α selection method (indicated by their acronyms) and regularization operator (color-coded). The panels are arranged from top left to bottom right in increasing order of lowest 75th-percentile inefficiency among L0, L1, and L2. For each histogram, only the part with inefficiency ≤ 3 is shown, and the often prolonged tails are not visible. The histograms are scaled such that the maxima in all panels are identical.