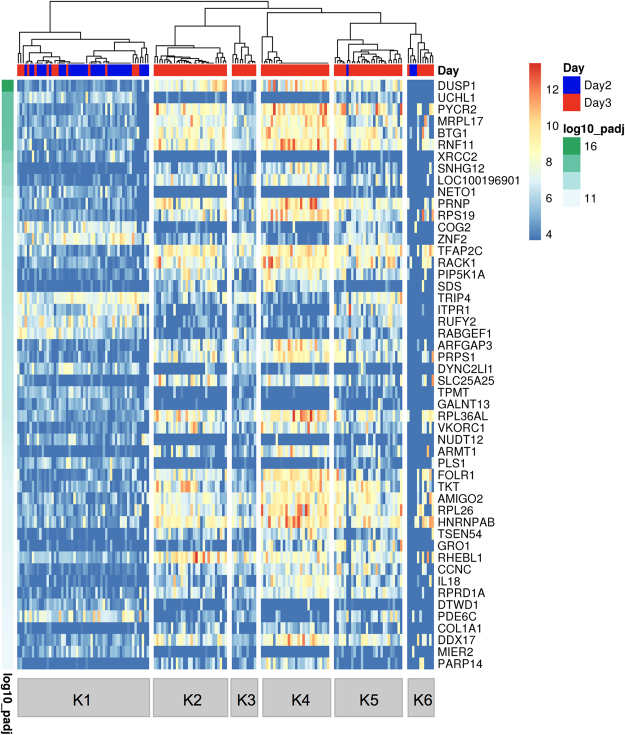
Figure 1.
Single-cell Consensus Clustering (SC3). Single-cell transcriptome profiles of 161 blastomeres from six Day 2 embryos and eight Day 3 embryos were analysed with the SC3 tool16. Differentially abundant transcripts (DAT) were identified with the non-parametric Kruskal-Wallis test. DAT were clustered with a pre-set number of six clusters and the results for the 50 top genes are shown. The adjusted p-value is shown on the left. A blue or red colour label in the embryo ID row indicates blastomeres collected from Day 2 or Day 3 embryos, respectively.

