
Figure 2.
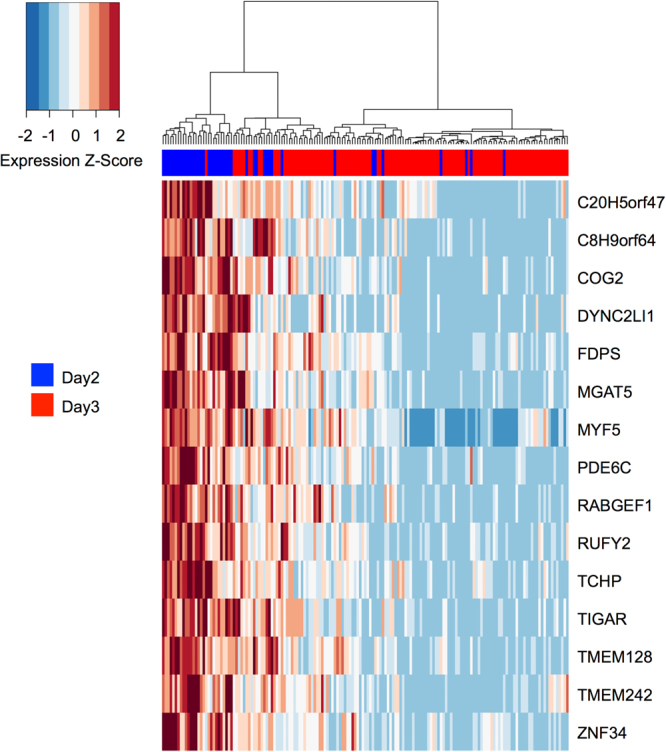
Michaelis-Menten Modelling of Dropouts (M3Drop). The single-cell transcriptome dataset of 161 blastomeres from six Day 2 and eight Day 3 embryos was analysed with the M3Drop tool18. Genes with detectable levels of transcripts in all blastomeres (genes not affected by dropouts; n = 15) were identified with the Z-test and hierarchical clustering was performed only on these genes. Expression values are displayed as Z-scores of log2 transformed expression data (adding a pseudo-count of 1). A blue colour label in the embryo ID row marks cells collected from Day 2 embryos; cells from Day 3 embryos are marked in red. Note that cells cluster independently of embryo age.