Fig. 7.
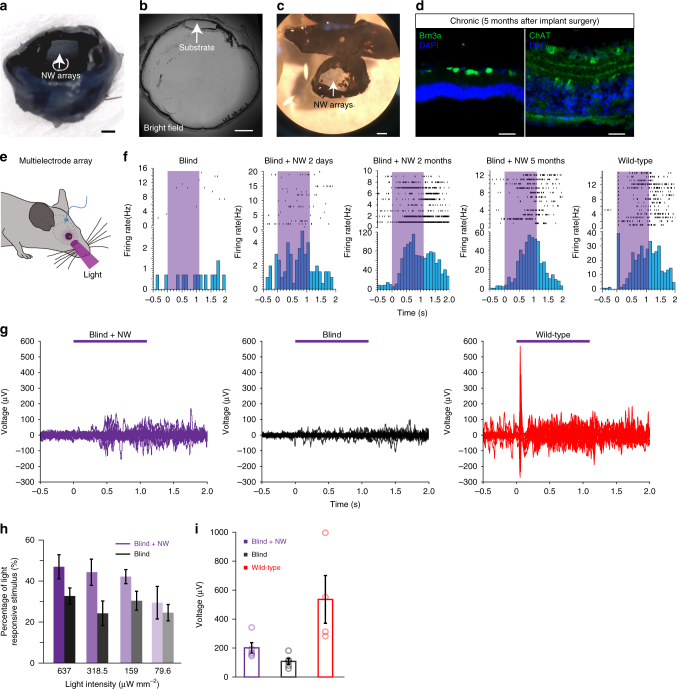
In vivo light responses after subretinal implant of NW arrays. a Explanted eye showing the position of the implanted NW arrays. b Slice of eyeballs in blind mice 7 weeks after implant surgery. c Dissected NW arrays-implanted eyecup 5 months after NW arrays implant surgery. d Brn3a and ChAT staining in higher magnification images showing the lamination of the NW arrays-implanted blind retina 5 months after implant. e Schematics of in vivo electrophysiology recording. The NW array was implanted subretinally, and multi-electrode array was inserted into the primary visual cortex to record light responses. f Raster plots and post stimulus time histograms (PSTHs) of spikes from V1 neurons in blind mice (left), NW arrays-implanted blind mice 2 days after implant (middle left), 2 months after implant (middle), 5 months after implant (middle right), and wild-type mice (right). The purple shade area indicates the presentation of light. g 15 traces of near UV light-evoked LFP responses in V1. Purple line indicates the presentation of light. h Percentage of stimuli that elicited responses in blind mice and NW arrays-implanted blind mice using different light intensities (Blind + NW: 637 μW mm–2, n = 6; 318.5 μW mm–2, n = 5; 159 μW mm–2, n = 5; 79.6 μW mm–2, n = 5. Blind: 637 μW mm–2, n = 6; 318.5 μW mm–2, n = 4; 159 μW mm–2, n = 4; 79.6 μW mm–2, n = 4. Two-tailed Student’s t-test, P637 = 0.016). i VEP amplitude in NW arrays-implanted blind mice, blind mice, and wild-type mice (n = 5 for NW arrays-implanted blind mice, n = 5 for blind mice, n = 4 for wild-type mice. Two-sided Wilcoxon rank-sum test, Pblind vs. blind+NW = 0.056). Data are presented as mean and S.E.M. Scale bars: 500 μm (a–c), 20 μm (d)

