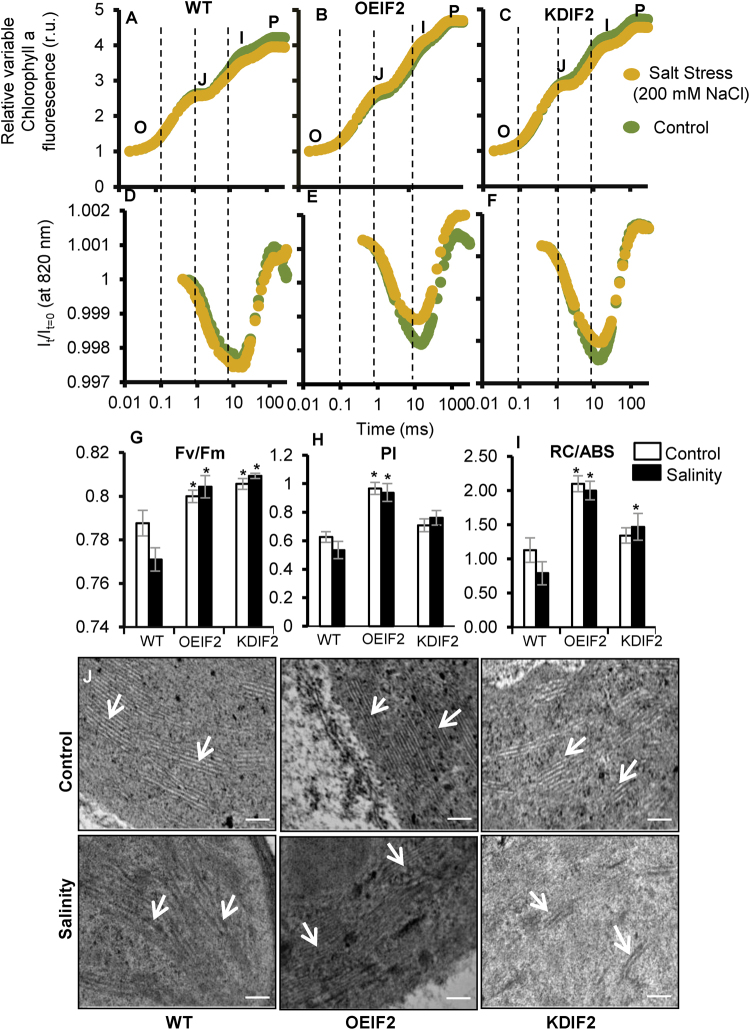
Figure 4.
Effect of salt stress on chlorophyll a fluorescence, 820 nm transmittance and grana integrity in the chloroplasts of rice leaves. (A–C) Simultaneously-measured chlorophyll a fluorescence induction curves; (D–F) 820 nm transmittance curves in WT, OEIF2 and KDIF2 rice plants under control and salinity stress. The curves are average of six different samples. (G) Fv/Fm; (H) PI (Performance Index); (I) RC/ABS, which is related to the number of active PSII reaction centers per PSII antenna Chl; (J) Ultrastructure of chloroplasts of WT, OEIF2 and KDIF2 lines, without salt (control), and after 24 h of salt (200 mM NaCl) stress, showed more disintegration of chloroplast grana in WT and KDIF2 shoots under stress than in OEIF2. Data are shown as mean ± SE, calculated from three independent experiments and the significant difference is shown as (*)p < 0.05 probability levels as compared to the WT under control and stress conditions. Bar = 200 nm.

