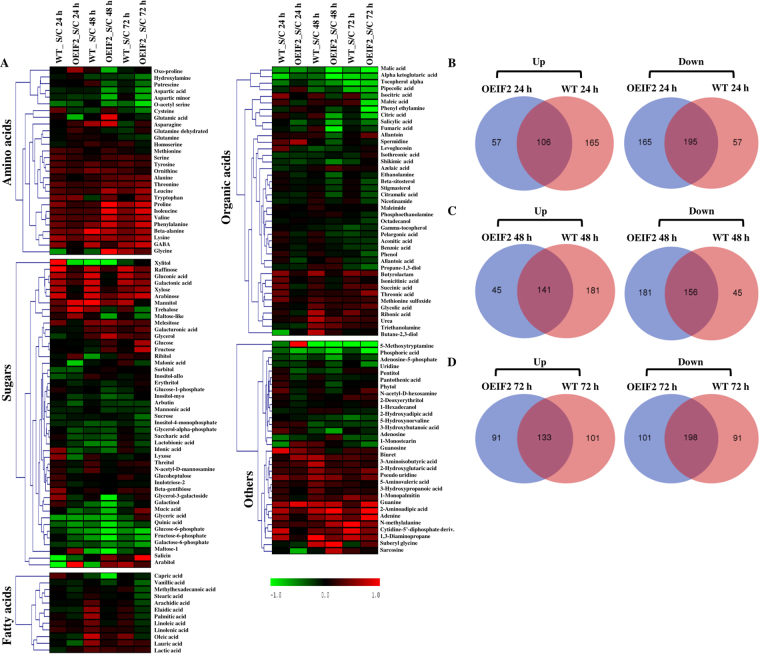
Figure 6.
Determination of metabolites in the wild type (WT) and in the OsIF over-expressing (OEIF2) transgenic lines, using gas chromatography-mass spectrometry. (A) Heat map of wild-type (WT) and OsIF over-expressed (OEIF2) transgenic lines showing differential accumulation pattern of various metabolites at 24 h, 48 h and 72 h time points of log2 value of fold change after calculating the ratio of stress and control (S/C) parameters. Venn diagrams showing increased (up) and decreased (down) metabolites between OEIF2 and WT at 24 h (B), 48 h (C) and 72 h (D) of salinity stress.

