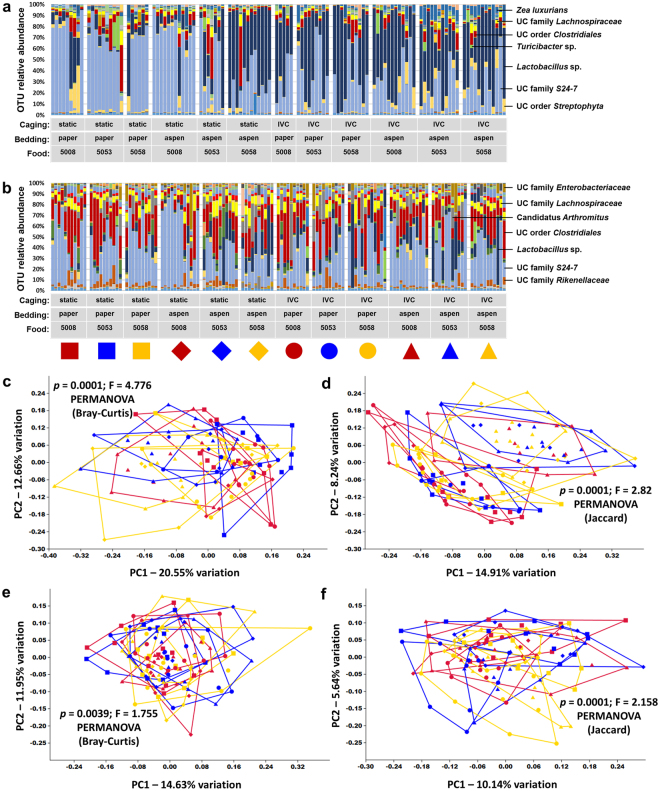
Figure 4.
Caging, bedding, and diet have minimal effect on small intestinal microbiota. (a,b) Stacked bar charts showing relative abundance of all operational taxonomic units (OTUs) detected in the jejunal (a) and ileal (b) contents of 16.5 week-old mice housed in static or ventilated (IVC) microisolator caging, with paper or aspen bedding, and fed one of three standard rodent chows (5008, 5053, or 5058), thirteen weeks after arrival, identity of prevalent operational taxonomic units (OTUs) at top right; (c,d) principal coordinate analysis (PCoA) of the samples shown in (a) based on Bray-Curtis (c) and Jaccard (d) distances, legend above; (e.f) PCoA of the samples shown in (b), based on Bray-Curtis (e) and Jaccard (f) distances. All p values indicate main effect, results of corresponding pairwise comparisons shown in Supplementary Tables S6 through S9. Combinations of colors and symbols are used to identify factors: red = 5008; blue = 5053; yellow = 5058; squares = static microisolators with paper bedding; diamonds = static microisolators with aspen bedding; circles = IVCs with paper bedding; triangles = IVCs with aspen bedding.

