Figure 4.
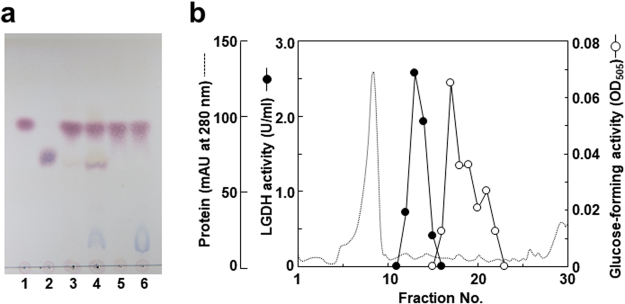
TLC analysis and anion-exchange chromatography of the enzyme activities against LG. (a) LG (1 mg/ml) was incubated at 50°C for 5 h in 60 mM Tris-HCl (pH 8.0) containing enzyme and/or NAD, and 10 μl of the reaction mixture was spotted on to a silica gel plate. TLC analysis was performed under the same conditions described in the legend of Fig. 2. Lane 1: LG (1 mg/ml), lane 2: glucose (1 mg/ml), lane 3: LG + crude extract (50 μg/ml), lane 4: LG + crude extract (50 μg/ml) + NAD (2 mM), lane 5: LG + LGDH (0.2 μl/μl of No. 13 fraction in Fig. 4b), lane 6: LG + LGDH (0.2 μl/μl) + NAD (2 mM). (b) Crude extract obtained from 30 ml of LG medium was applied to a HiTrap Q column (1 ml) equilibrated with 50 mM Tris-HCl buffer (pH 8.0). The column was washed with 5 ml of the same buffer and eluted with a linear gradient of 0–0.3 M KCl (1 ml per fraction). For glucose-forming activity, 1 mg/ml of LG, 10 μl of each fraction, 10 μl of No. 13 fraction, and 2 mM NAD were incubated at 40°C for 5 h in 30 mM Tris-HCl buffer (pH 8.0), and glucose in the reaction mixture was assayed by glucose oxidase method.

