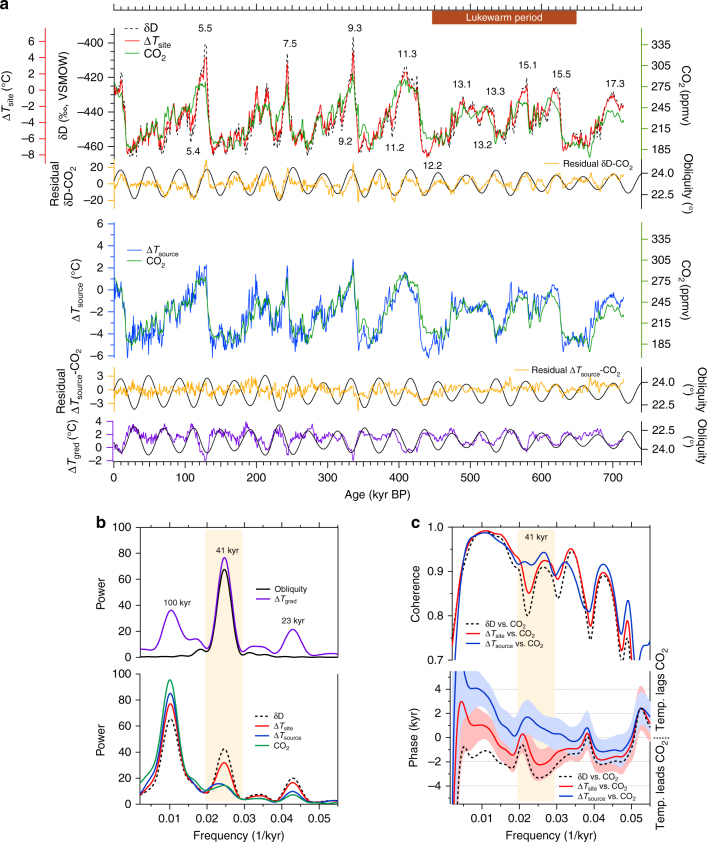
Fig. 3.
Temperature reconstructions from the DF2 core together with the CO2 record. a The upper panel shows the DF δD (black) and ΔTsite (red) records and the CO2 composite record32 (green), as well as the residuals from a linear regression between δD and CO2 (orange) and obliquity (black). The lower panel shows DF ΔTsource (blue) and the CO2 composite record (green). DF ΔTgrad (purple) with obliquity (black) is shown at the bottom. The δD (or ΔTsource) axis was scaled to fit a linear regression between δD (or ΔTsource) and CO2. Numbers indicate Marine Isotope Stages. b Power spectra of Earth’s obliquity (black) and DF ΔTgrad (purple), DF δD (black dotted), ΔTsite (red), ΔTsource (blue) and the CO2 composite record32 (green). c Upper panel: coherence of δD vs. CO2 (black dotted), ΔTsite vs. CO2 (red) and ΔTsource vs. CO2 (blue). Lower panel: same as upper panel but for phase lag. Red and blue colours indicate uncertainty ranges (Methods). The uncertainty range of CO2 vs. δD is similar to that of CO2 vs. ΔTsite; however, it is not shown here for clarity. The obliquity band is shown in yellow

