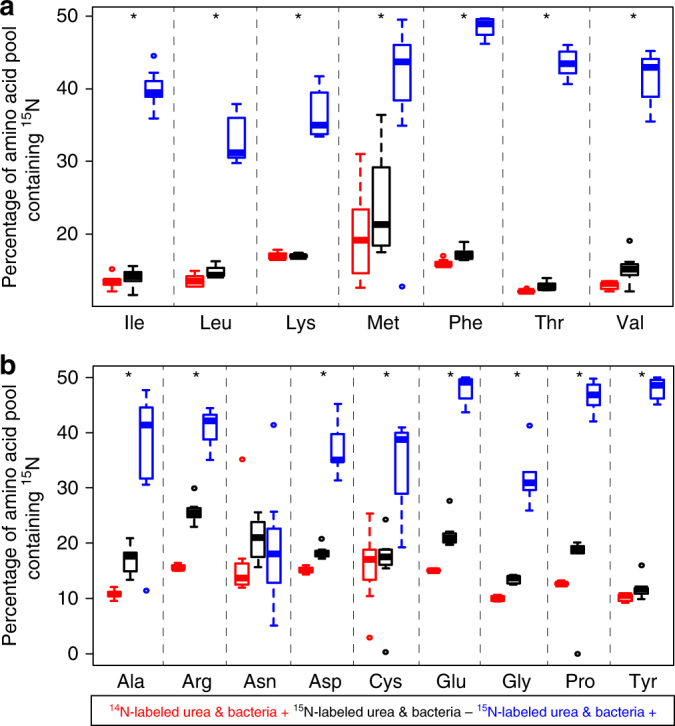
Fig. 2.

Symbiont suppression reduces proportions of 15N-labeled amino acids in hemolymph of Cephalotes varians workers consuming 15N-labeled urea. a Essential and b non-essential amino acids in ant hemolymph measured through GC–MS. Asterisks indicate that 15N in essential amino acids from ants consuming 15N-labeled urea (blue) was significantly higher than that in antibiotic-treated ants on this same diet (black) and in those consuming diets with unlabeled urea (red). Details on sample sizes for each treatment can be found in Supplementary Data 6. Note that each separate box plot graphs the median (center line), the interquartile range (i.e., from the top to the bottom of each box), values equal to 1.5 times the interquartile range (tops and bottoms of whiskers), and outliers. Amino acids for which we observed significantly higher heavy isotope signal in the no antibiotic (blue) versus antibiotic (black) treatments, on the heavy isotope diet, are indicated with an asterisk. Statistics are described in the Supplementary Methods and Supplementary Table 3. In short, asterisks reveal results from Tukey’s post hoc tests (for normally distributed data after logit transformation) or Wilcoxon rank sum tests (for non-normal data after logit transformation)
