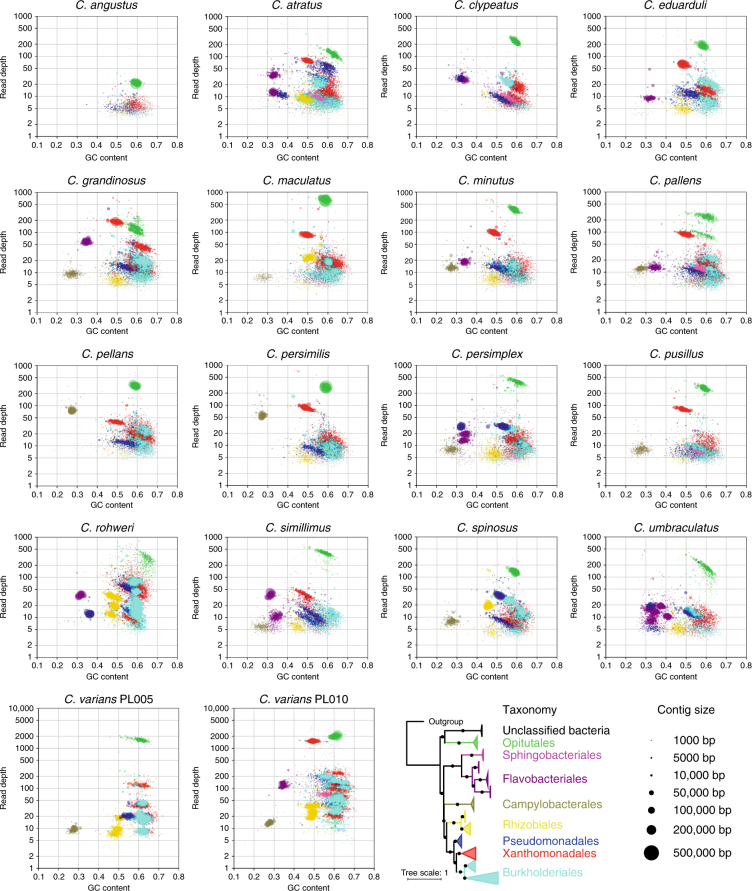
Fig. 3.
Taxon-annotated GC-coverage plots for 18 Cephalotes metagenomes reveal strong microbiome conservation. Assembled scaffolds in each metagenome are plotted based on their %GC content (x-axis) and their depth of sequencing coverage (y-axis, log scale). Bacterial genomes vary in %GC genome content and core symbionts show variable abundance; these plots, thus, illustrate the co-existence of numerous dominant symbiont strains in Cephalotes worker guts. The phylogeny at lower right, based on 16S rRNA sequences from our metagenomes, identifies the Cephalotes-specific clades from which nearly all of our sequence data have been obtained. Colors on the phylogeny match those in the blob plots, illustrating the taxa to which scaffolds were assigned. Circle size indicates length of each scaffold. Not shown here are scaffolds binning to Hymenoptera or to unclassified organisms. Note that for each metagenome library, DNA was obtained from a total of 10 workers from a single colony

