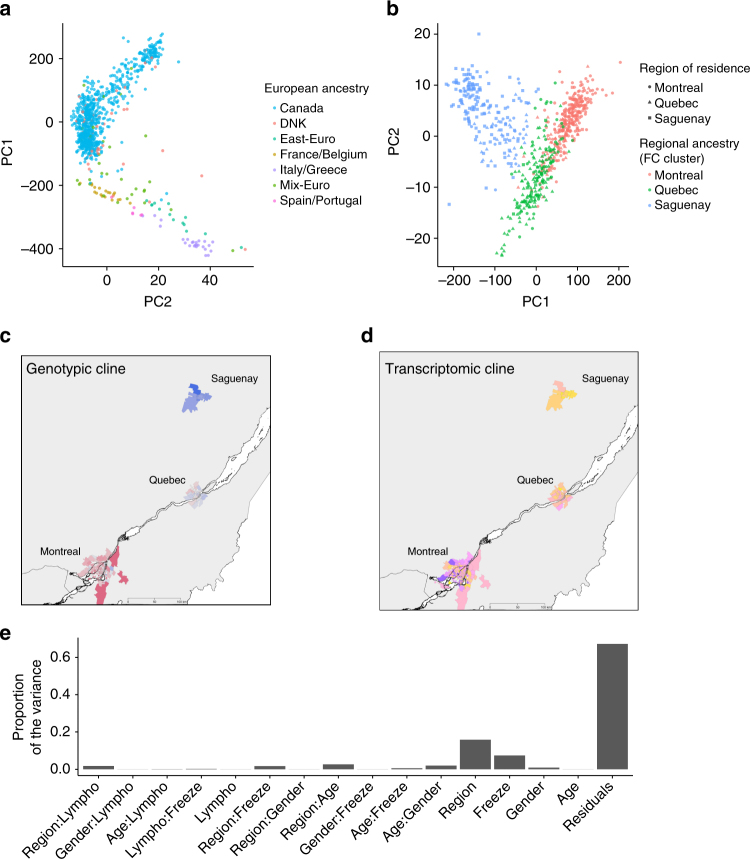
Fig. 1.
Genetic and transcriptomic variation within the CARTaGENE cohort sample. a Principal component analysis (PCA) of individuals of European descent, including FCs (n = 887). Individuals are labeled according to self-declared ancestry based on the origin of four grandparents. b PCA on the haplotype chunk61 count matrix of French-Canadians (n = 689) reveals three groups corresponding the region of residence, with SAG individuals showing less overlap with either of MTL or QUE individuals, in line with their historical isolation25, 26. c Genotypic cline for individuals by location of residence (three-digit postal code) sampled across the province. Color indicate the average value of the first principal component from a PCA on genotypes in each three-digit postal code district level (n = 157). d Transcriptomic cline for individuals by location of residence sampled across the province. Colors represent the average value of the first principal component from a PCA on the transcriptome in each three-digit postal code district level (n = 189). e Proportion of transcriptomic variance (PVCA) in FCs explained by low-level phenotypes and their interactions

