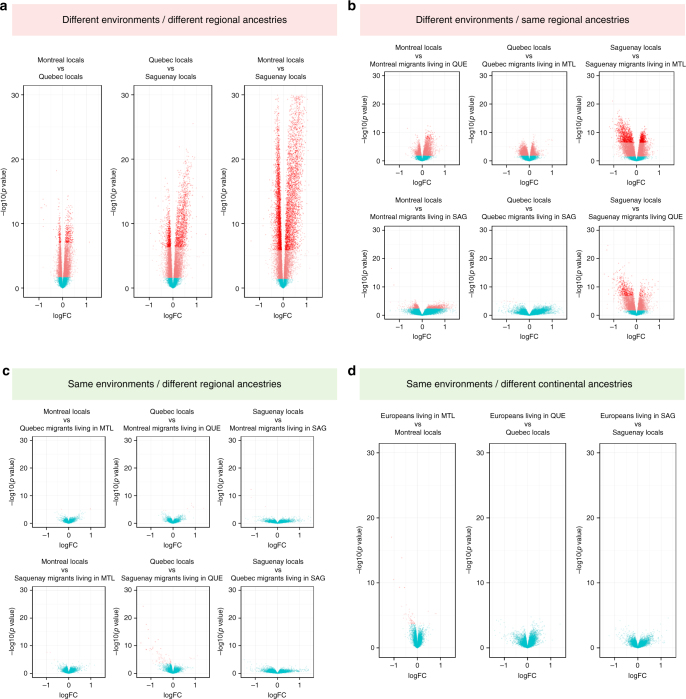
Fig. 2.
Environmental impacts on gene expression profiles override that of genotype. Contrasting the effects of ancestry and regional environment on differential gene expression. a Between FC-locals (different regional ancestry, different regional environments). b Between FC-locals and FC regional migrants (same regional ancestry, different regional environments). c Between FC-locals and FC regional migrants (different regional ancestries, same regional environment). d Between FC-locals and Europeans (different continental ancestries, same regional environment). Pink dots are genes with FDR (q value) below 5% and red dots are genes with p value < Bonferroni-corrected p value (3.20 × 10⁻⁶)

