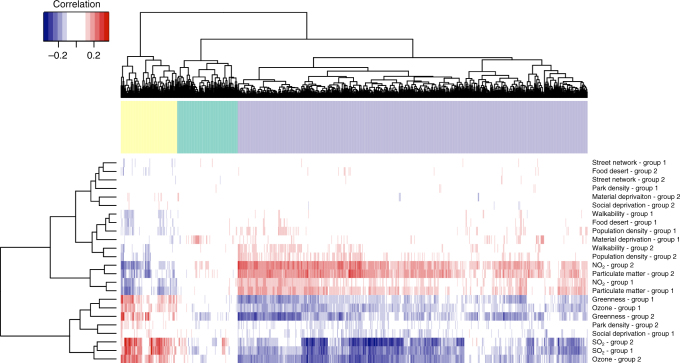
Fig. 3.
Differentially expressed genes are associated with local ambient air pollution. Coinertia (CoIA) analysis between gene expression (columns) and fine-scale environmental variables (rows). CoIA analyses were performed on genes that were significantly differentially expressed among regions and the regulators of those genes (RDEG). CoIAs were computed between differentially expressed genes profiles and fine-scale environmental data (Supplementary Figs 11 and 12). We performed two sets (Group 1 and Group 2, each composed of a random draw of half the cohort) of CoIAs: each set included 10,000× resampling of 200 individuals (without replacement, from Group 1 or Group 2), and the CoIAs were performed between environment and gene expression for each of the 10,000 iterations. Supplementary Fig. 11 depicts the resampling scheme. The heatmap represents, for each Group 1 or Group 2, the median of each environment–gene associations from the cross-tabulated values distribution. Associations from Group 1 and Group 2 largely cluster together, indicating a strong signal of the association between fine-scale air pollution levels and gene expression. A permutation test (n = 10,000 steps) indicates the that the correlations between the matrices are significant (p = 0.00089 and p = 9.9 × 10⁻⁵ for Group 1 and 2 respectively)

