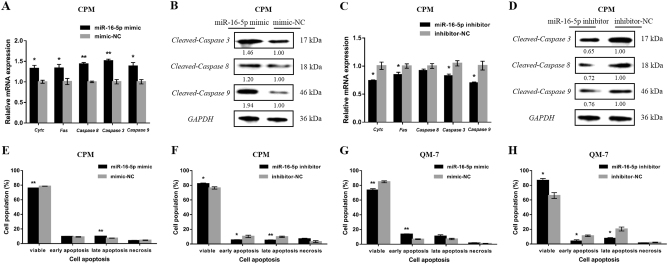
Fig. 2. miR-16-5p facilitates myoblast apoptosis.
a, c mRNA levels of several apoptosis-related genes induced by miR-16-5p overexpression and inhibition in CPMs. b, d The protein expression levels of several cleaved caspases with miR-16-5p overexpression and inhibition in CPMs. The numbers shown below bands were folds of band intensities relative to control. Band intensities were quantified by ImageJ and normalized to GAPDH. Data are expressed as a fold change relative to the control. e, f Annexin V-FITC and propidium iodide (PI) dual staining detection of the apoptosis of CPMs after overexpression and inhibition of miR-16-5p, as determined by flow cytometry. g, h Annexin V-FITC and PI dual staining detection of the apoptosis of QM-7 cells after overexpression and inhibition of miR-16-5p, as determined by flow cytometry. In all panels, data are presented as mean ± S.E.M. of three biological replicates. Statistical significance of differences between means was assessed using an unpaired Student’s t-test (*P < 0.05; **P < 0.01) vs. NC, negative control

